CAR T-Cell Therapy Hits a New Inflection Point 📌
The CAR T-cell therapy market for non-Hodgkin's lymphoma (NHL) has officially crossed into blockbuster territory. According to a new market intelligence report covering the seven major markets (7MM) — the US, Germany, France, Italy, Spain, the UK, and Japan — the market reached approximately $3.20 billion in 2025 and is forecast to expand at a ~7% CAGR from 2026 to 2036.
The United States alone generated roughly $1.90 billion, cementing its dominance with about 68,000 incident cases out of ~159,000 across the 7MM. Diffuse large B-cell lymphoma (DLBCL) remains the largest addressable indication, with approximately 78,000 cases.
For investors, this isn't just about oncology science — it's about a maturing commercial engine that is moving from last-resort therapy to earlier-line standard of care. 💡
Key takeaway: This is no longer a speculative niche. CAR T-cell therapy is a revenue-generating, guideline-backed modality with a multi-billion dollar runway.

The Competitive Landscape: Who Owns the NHL CAR T Market? 📊
Four approved products currently anchor the market:
- YESCARTA (Gilead/Kite) — the first-mover with the broadest label expansion, including the February 2026 FDA update removing the primary CNS lymphoma limitation.
- KYMRIAH (Novartis) — the pioneer in pediatric and young adult settings, now expanding into earlier lines.
- BREYANZI (Bristol Myers Squibb) — recently approved for marginal zone lymphoma in December 2025, broadening its NHL footprint.
- TECARTUS (Gilead/Kite) — received full FDA approval for relapsed/refractory mantle cell lymphoma in April 2026, backed by ZUMA-2 data.
The real story, however, is in the pipeline. Next-generation autologous and allogeneic candidates — including CTX110 (CRISPR Therapeutics), zamtocabtagene autoleucel (Miltenyi), cemacabtagene ansegedleucel/ALLO-501A (Allogene), rapcabtagene autoleucel (Novartis), and MB-106 (Mustang Bio) — are targeting the core bottlenecks: manufacturing speed, product consistency, and accessibility.
If allogeneic therapies deliver on their promise of "off-the-shelf" availability, the entire treatment paradigm could shift from specialized academic centers to broader community oncology networks. That's a TAM expansion story, not just a market-share fight.
For a broader look at how single-use bioprocessing is enabling this cell therapy scale-up, see our analysis on cell culture media bags market growth.
The market's direction hinges on whether allogeneic therapies can deliver — and investors are split on the timeline.

Seven Major Markets: Regional Breakdown & Forecast Assumptions 📈
| Region | 2025 Market Size | Key Dynamics |
|---|---|---|
| United States | ~$1.90B | Largest market; driven by earlier approvals, high adoption, and faster label expansions |
| Germany | Largest in EU4+UK | Strong reimbursement infrastructure; leading European adopter |
| Italy | Second in EU4 | Growing specialist-center capacity |
| Spain | Smallest in EU4 | Slower reimbursement cycles; potential upside |
| Japan | Steady growth | Improving access; novel product entries expected |
Technical Insight: What the Charts Are Signaling 🧠
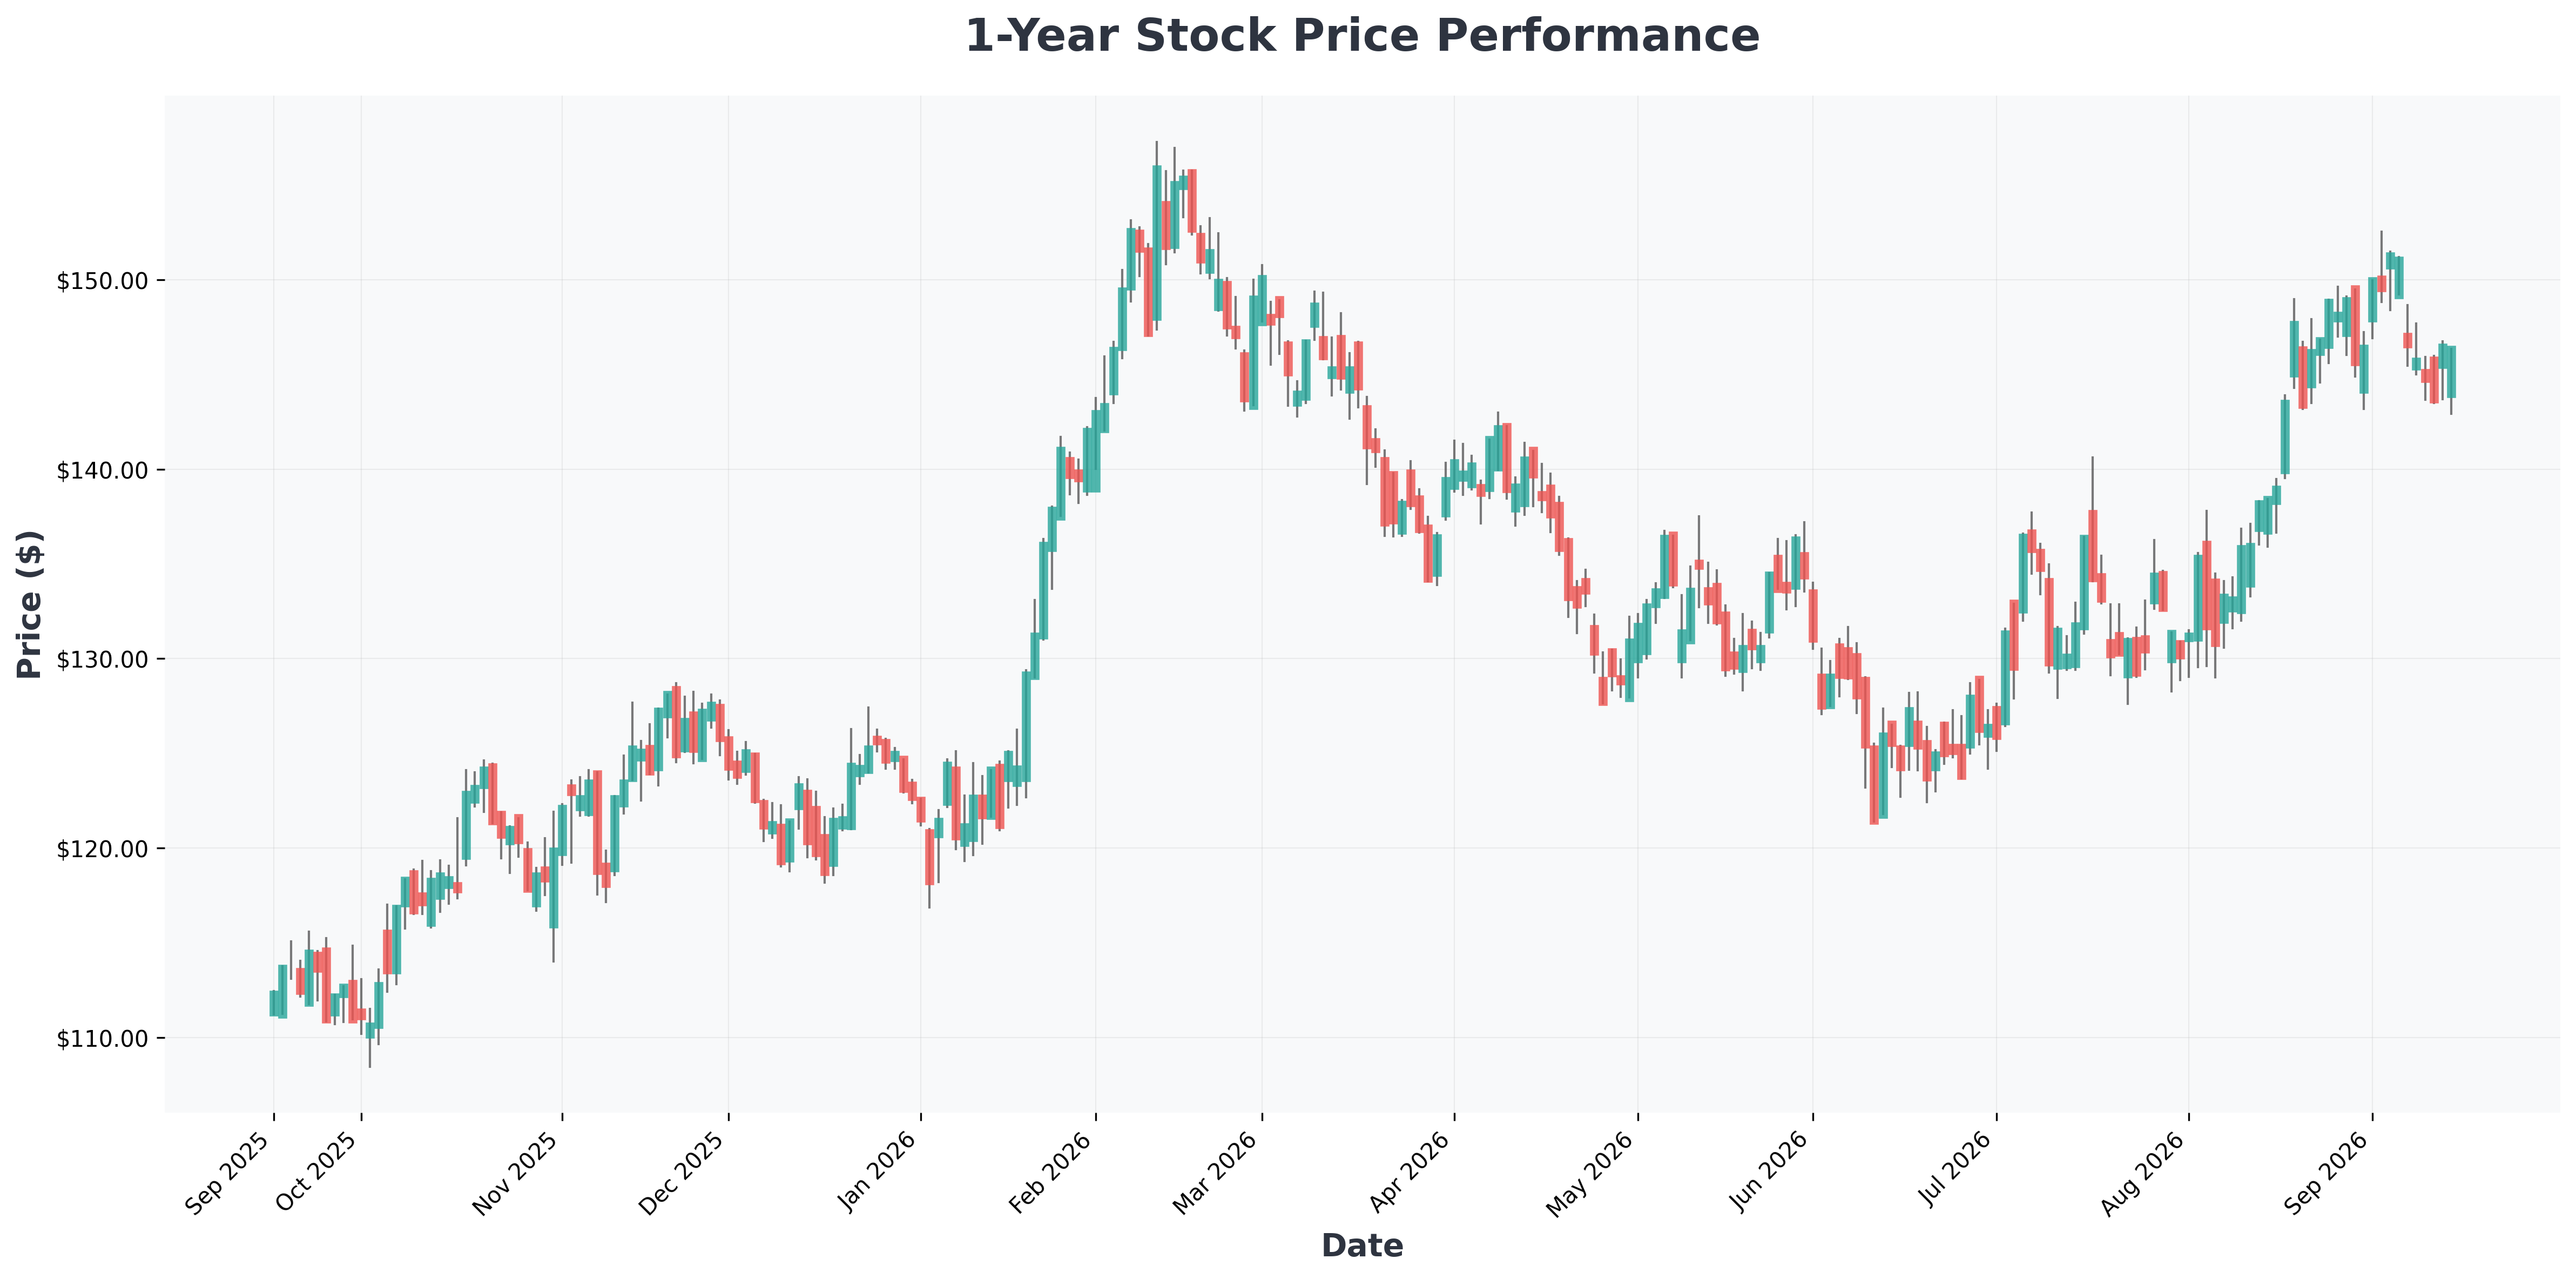
From a technical analysis perspective, the biotech sector (XBI) has been forming a higher-low structure since late 2025, with the 200-day moving average acting as dynamic support. If CAR T leaders like Gilead and BMS continue to post positive pipeline catalysts, the sector could test prior resistance levels. Historically, similar post-approval expansion cycles in oncology (e.g., checkpoint inhibitors from 2014–2018) saw a 12–18 month re-rating window before valuations normalized.
Unmet Needs = Investment Opportunity ⚠️
The market still faces real barriers: cytokine release syndrome (CRS), neurotoxicity, manufacturing timelines, prior authorization hurdles, and total treatment costs. Companies that solve these — particularly in allogeneic manufacturing — could capture disproportionate value.
📊 In-Depth Fundamental Analysis
| Company | Share Price | P/E Ratio | P/B Ratio | ROE | Operating Margin (OPM) | Revenue Growth |
|---|---|---|---|---|---|---|
| AUTL (Autolus) | $2 | 0.00 | 0.33 | -133.00% | -95.95% | 118.40% |
| BMY (Bristol-Myers) | $64 | 14.12 | 5.87 | 46.60% | 34.42% | 5.70% |
| CRSP (CRISPR) | $53 | 0.00 | 2.92 | -26.10% | -1127.55% | 1041.40% |
| GILD (Gilead) | $149 | 0.00 | 15.58 | -20.68% | 33.68% | 10.20% |
| JNJ (Johnson) | $268 | 31.03 | 7.59 | 25.74% | 29.19% | 6.60% |
| MBIO (Mustang) | $1 | 0.00 | 0.51 | -58.12% | 0.00% | 0.00% |
| NVS (Novartis) | $139 | 21.00 | 6.37 | 30.35% | 34.62% | 0.80% |
| TAK (Takeda) | $19 | 0.00 | 1.21 | -2.26% | 16.45% | 10.20% |

Best Case vs. Worst Case Scenario 🎯
| Scenario | Drivers | Implication |
|---|---|---|
| Bull Case | Allogeneic therapies approved by 2028–2029; earlier-line expansion accelerates; reimbursement broadens in EU4 | Market could exceed $6B by 2036; Gilead and Novartis benefit most |
| Base Case | ~7% CAGR holds; autologous products dominate; incremental label expansions | Market reaches ~$6.3B by 2036; steady but not explosive |
| Bear Case | Manufacturing bottlenecks persist; safety events trigger regulatory delays; pricing pressure from payers | Growth stalls below 5% CAGR; smaller players struggle to fund trials |
Final Thoughts 💡
The CAR T-cell therapy market in NHL is transitioning from a high-science, high-risk frontier to a commercially validated growth engine. The next 24 months will be critical: watch for allogeneic readouts, FDA label expansions, and reimbursement decisions in Europe and Japan.
For investors looking at adjacent opportunities in the bioprocessing supply chain, our breakdown of top-ranked stocks ahead of Q2 earnings offers additional context on where capital is flowing.
Disclaimer: This analysis is for informational purposes only and does not constitute investment advice. Biotech investments carry significant risk, including clinical trial failures and regulatory setbacks. Always conduct your own due diligence.