The Federal Reserve, now under the leadership of Chair Kevin Warsh, has once again held its benchmark interest rate steady at 3.5%-3.75% 📊. This marks the second consecutive pause, but unlike the unanimous decision in June, the July 29 meeting concluded with a striking 9-3 vote count. This is the most significant dissent we've seen in a decade, and it's a clear signal that the path forward is anything but clear.

The Core Tension: Inflation vs. Economic Stability
The central debate within the Fed circles around inflation. While recent CPI data showed a cooling from May, the year-over-year figure still sits at a concerning 3.5%, well above the Fed's 2% target. The primary tool to combat this is raising interest rates, which cools spending by making borrowing more expensive. However, this also risks slowing down economic growth and potentially triggering a recession.
Adding to this complexity is the volatile energy market. Geopolitical tensions have driven crude oil prices from around $68 in early July to a peak of $92, before settling near $84. This rebound in energy costs is likely to feed into the next inflation readings, reversing the recent downtrend in gasoline and fuel oil prices. This makes the Fed's job considerably harder, as they must now factor in an external supply-side shock that monetary policy cannot directly control.
The 9-3 vote has split the market's opinion. Here’s what the bulls and bears are arguing on Wall Street:

The Warsh Factor: A New Era of Fed Communication
A key difference under Chair Warsh is his aversion to forward guidance. Unlike his predecessor, who often provided hints about future policy moves, Warsh has made it clear he will not preview decisions. This lack of clarity forces investors to rely more heavily on economic data and market pricing, which can lead to increased volatility.
This communication strategy, combined with the internal division, creates a challenging environment. The market is now left to guess the Fed's next move. While the consensus leans toward a 'wait-and-see' approach, the risk of a hike in September is clearly on the table. For those looking to understand broader market dynamics, analyzing mega-cap tech performance can offer clues, as seen in our deep dive into the path of AI chip giant TSMC.
📊 In-Depth Fundamental Analysis
| Company | Share Price | P/E Ratio | P/B Ratio | ROE | Operating Margin (OPM) | Revenue Growth |
|---|---|---|---|---|---|---|
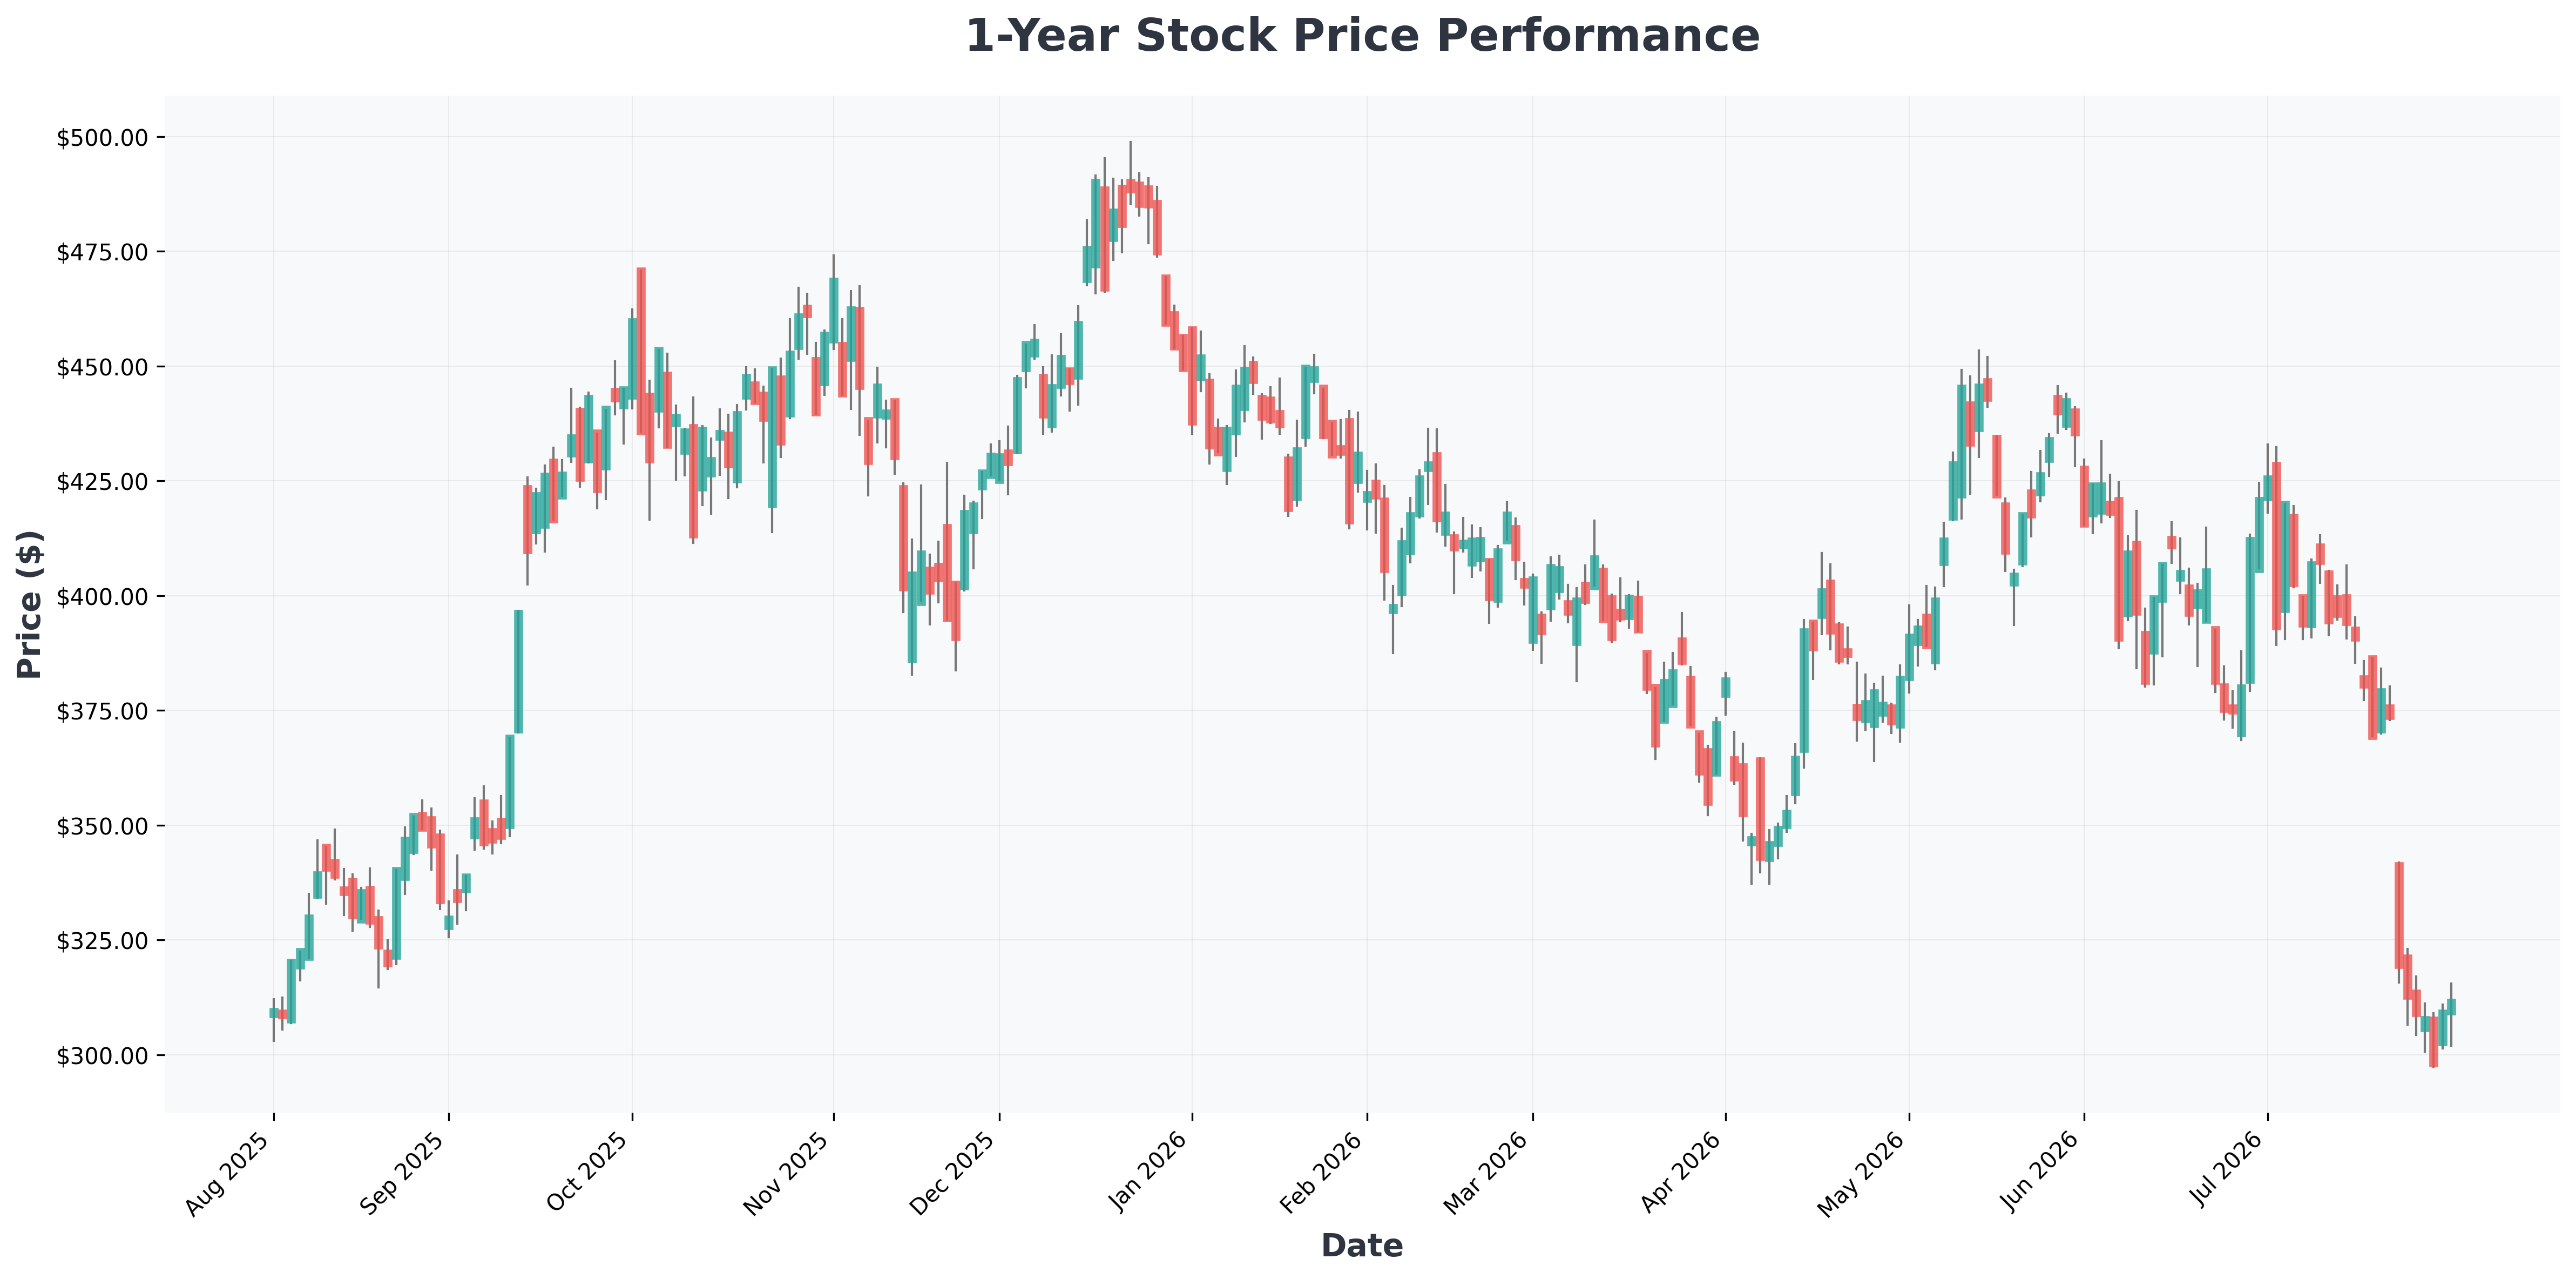
| AAPL (Apple) | $307 | 35.30 | 41.77 | 148.75% | 32.62% | 16.40% |
| GOOG (Alphabet) | $374 | 18.73 | 7.34 | 48.68% | 34.03% | 24.20% |
| GOOGL (Alphabet) | $375 | 18.78 | 7.36 | 48.68% | 34.03% | 24.20% |
| META (Meta) | $594 | 22.36 | 6.18 | 29.85% | 30.88% | 28.00% |
| MSFT (Microsoft) | $490 | 27.30 | 8.22 | 34.04% | 45.11% | 17.70% |
| NVDA (NVIDIA) | $208 | 31.95 | 25.81 | 114.29% | 65.60% | 85.20% |
| AMZN (Amazon.com,) | $284 | 22.82 | 6.91 | 30.56% | 13.69% | 19.60% |
| TSLA (Tesla,) | $322 | 295.32 | 14.37 | 4.67% | 1.41% | 25.50% |

Scenario Analysis & Investment Outlook
Given the data, we can outline potential scenarios for the coming months:
| Scenario | Conditions | Likely Fed Action | Market Impact |
|---|---|---|---|
| Bullish | Oil prices stabilize below $80, and core inflation shows a consistent monthly decline. | Hold rates steady through Q3, with potential for a cut in Q4. | Equities rally, bond yields fall, and growth stocks outperform. |
| Bearish | Oil prices surge past $95, and inflation re-accelerates sharply. | A 25 basis point rate hike in September, with a hawkish tone. | Market correction, value and energy stocks outperform, bond yields spike. |
| Base Case | Inflation remains sticky but doesn't spike. Oil prices hover in the $80-$90 range. | A single 'insurance' rate hike in September to reassert credibility, then a prolonged pause. | Increased volatility, with a rotation into defensive sectors and dividend-paying stocks. |
Conclusion: The current environment is a stock-picker's market. The probability of a rate hike in September is higher than many expect, but the Fed is also wary of overtightening. A prudent strategy is to focus on companies with strong pricing power that can withstand margin pressure from higher energy costs. For a long-term perspective, consider sectors with structural tailwinds, such as nuclear energy, which is seeing a resurgence. You can find our analysis on the best long-term uranium stock plays to hedge against energy-driven inflation.