📌 The Allure and Risk of High-Yield Dividends
Chasing an 8%+ dividend yield can feel like finding a goldmine in a bear market. But in today’s volatile landscape, many high-yield stocks are simply value traps waiting to slash payouts. The real skill isn't just finding a high yield — it's knowing if the cash flow can support it. 📊
We analyze the three definitive signals that separate a sustainable income machine from a dividend disaster. If a stock passes all three tests, it might just be the cornerstone of your long-term retirement portfolio.

🧠 Signal #1: Free Cash Flow Coverage Ratio > 1.5x
A dividend is only as safe as the cash that backs it. ⚠️
Look at the Free Cash Flow (FCF) Payout Ratio. If a company pays out less than 70% of its FCF as dividends, the yield is generally sustainable. For an 8%+ yield, the FCF coverage ratio (FCF / Dividend Paid) should be above 1.5x. This ensures the company can reinvest in growth and weather a downturn without touching the dividend.
Example: A REIT with an 8.5% yield but a FCF payout ratio of 55% is far safer than a telecom with 9% yield and a 95% payout ratio. 📉
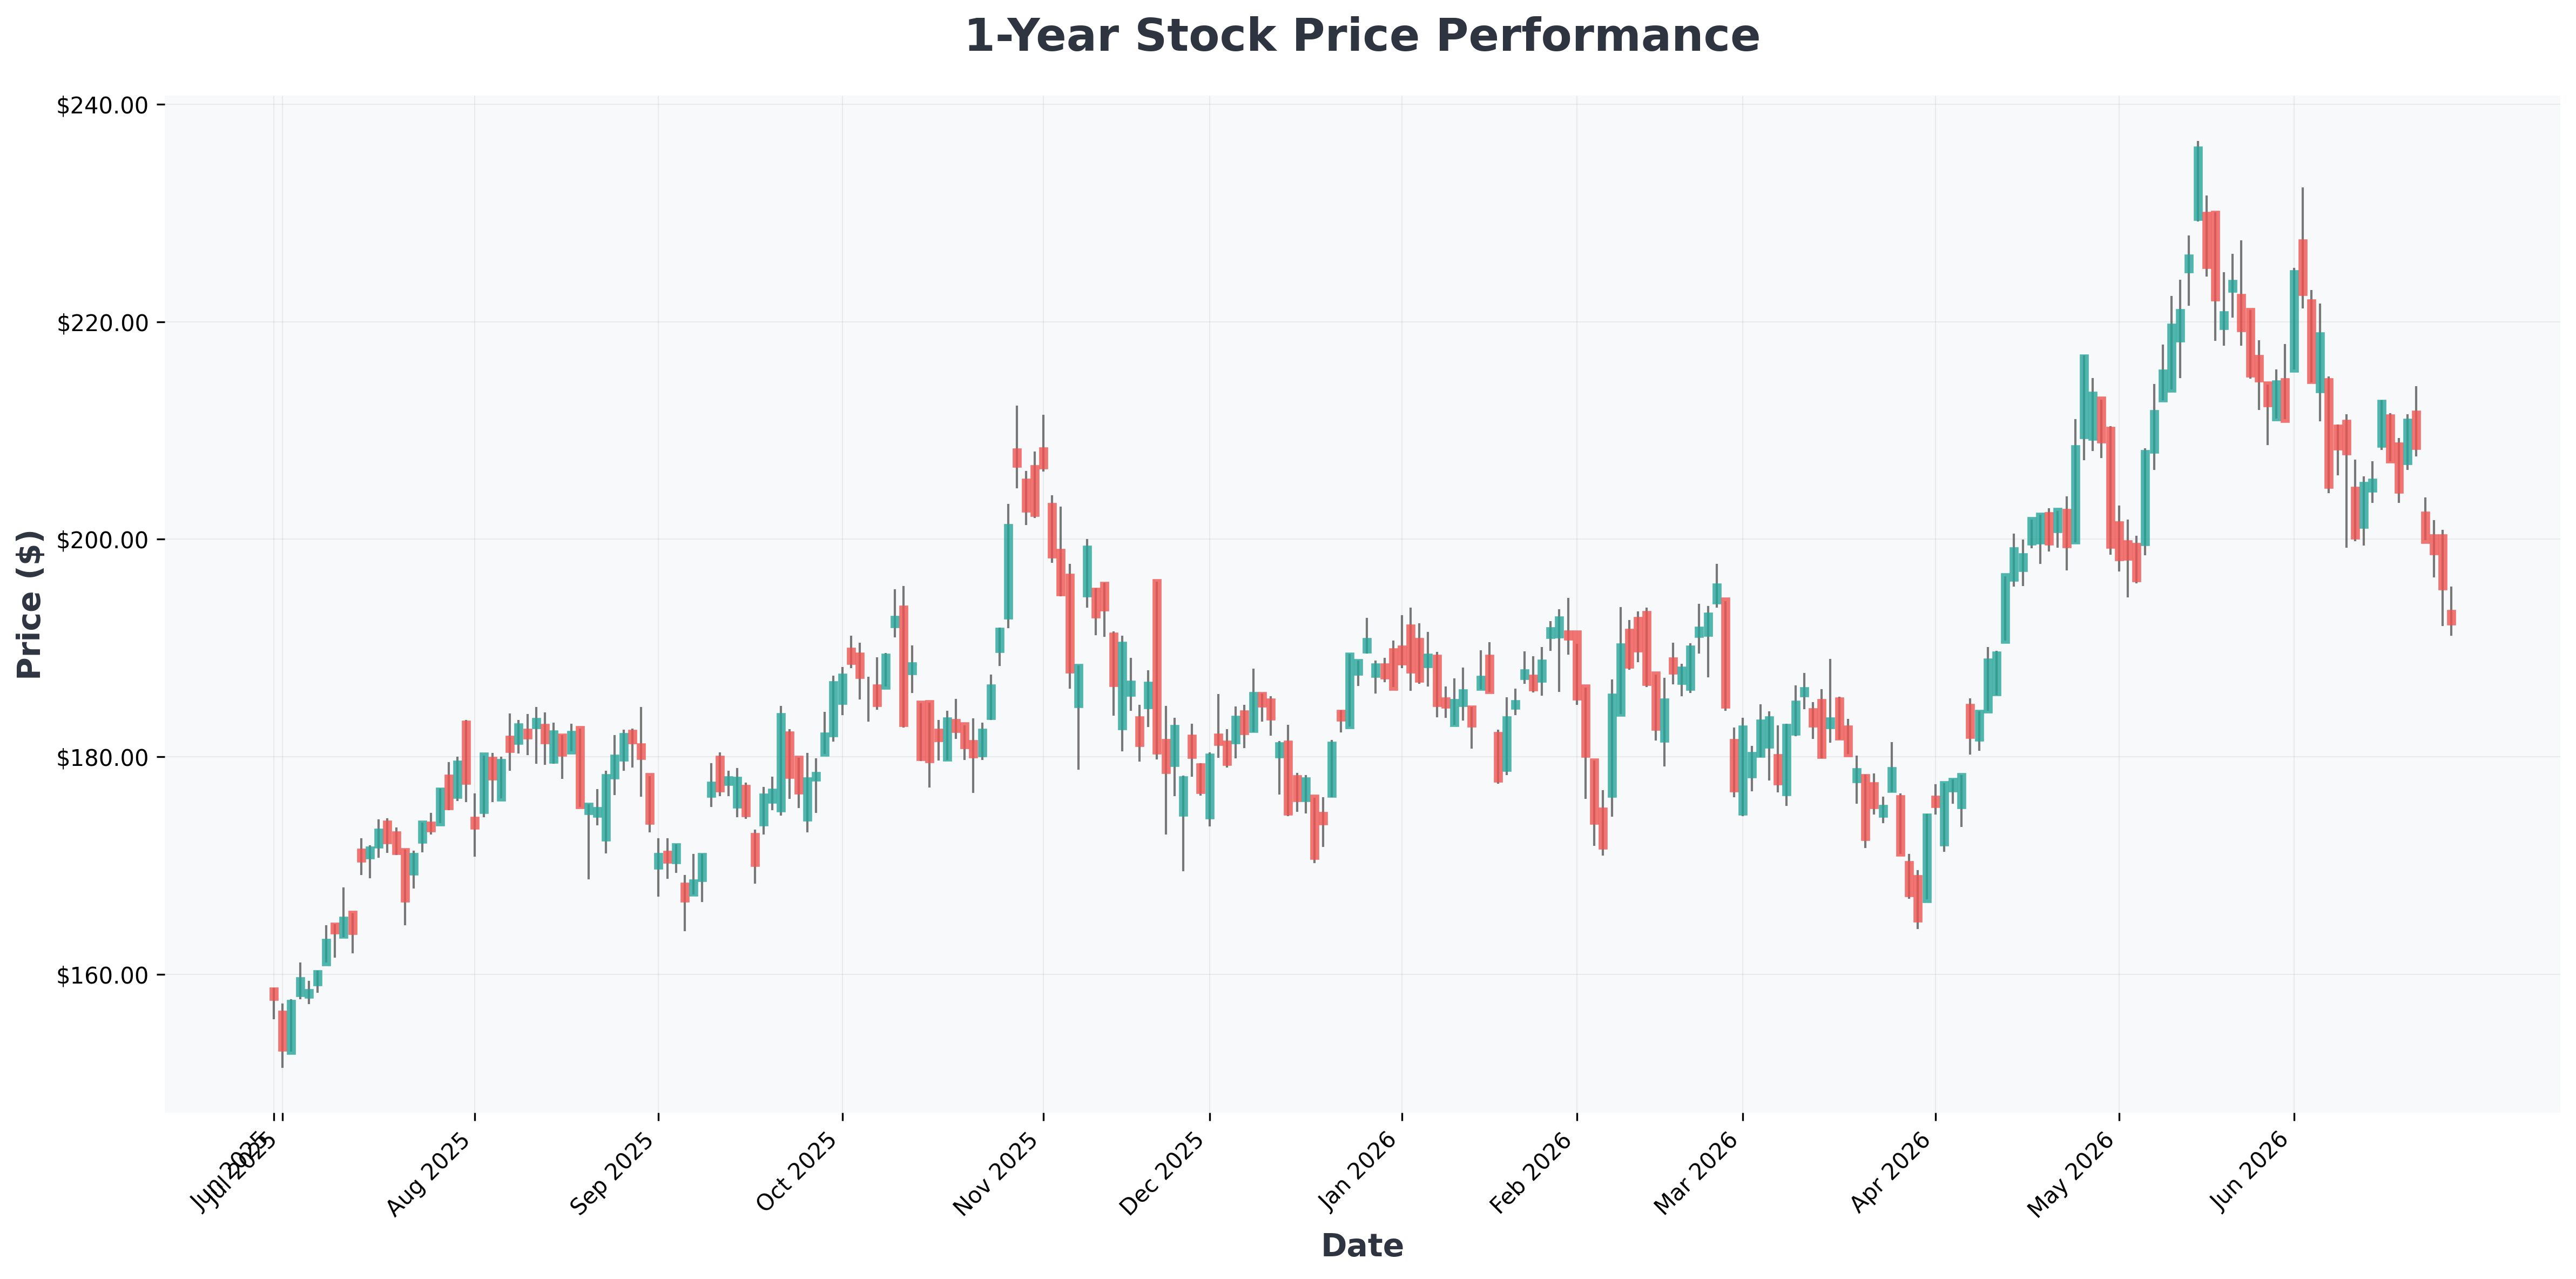
The market is split on whether high-yield dividend stocks are a safe bet right now. Here’s the bull vs. bear debate:
🛡️ Signal #2: Low Debt-to-EBITDA & Interest Coverage
High debt is the #1 killer of high dividends during a recession. 💸
Check the Debt-to-EBITDA ratio. Anything above 4.0x is a red flag. Also, verify the Interest Coverage Ratio (EBIT / Interest Expense). A ratio below 3.0x means the company is struggling to pay its debt, and the dividend is the first thing to cut.
| Metric | Safe Zone | Danger Zone |
|---|---|---|
| Debt-to-EBITDA | < 3.0x | > 4.5x |
| Interest Coverage | > 5.0x | < 2.5x |
| FCF Payout Ratio | < 70% | > 90% |
If a stock fails this test, even a 10% yield is not worth the risk. 🚨
📊 In-Depth Fundamental Analysis
| Company | Share Price | P/E Ratio | P/B Ratio | ROE | Operating Margin (OPM) | Revenue Growth |
|---|---|---|---|---|---|---|
| AAPL (Apple) | $281 | 34.05 | 38.74 | 141.47% | 32.27% | 16.60% |
| STRL (Sterling) | $817 | 73.04 | 21.08 | 36.68% | 17.16% | 91.60% |
| MSFT (Microsoft) | $370 | 22.03 | 6.63 | 34.01% | 46.33% | 18.30% |
| NVDA (NVIDIA) | $195 | 29.81 | 24.12 | 114.29% | 65.60% | 85.20% |
| NVT (nVent) | $164 | 55.92 | 6.98 | 13.00% | 16.00% | 53.50% |
| GOOGL (Alphabet) | $353 | 26.87 | 8.92 | 38.88% | 36.12% | 21.80% |
| CRDO (Credo) | $246 | 98.25 | 22.07 | 34.41% | 35.66% | 157.00% |
| AMZN (Amazon.com,) | $241 | 32.75 | 5.86 | 24.29% | 13.14% | 16.60% |
| GOOG (Alphabet) | $350 | 26.71 | 8.87 | 38.88% | 36.12% | 21.80% |

🔮 Scenario Analysis & Final Verdict
Best-Case Scenario 📈
- The company maintains or grows the dividend for the next 3 years.
- FCF improves due to cost-cutting or revenue growth.
- The stock appreciates 15-20% as yield compression occurs.
Worst-Case Scenario 📉
- A recession hits, revenues drop 20%, and the dividend is cut by 50%.
- The stock price falls 30-40%, wiping out years of income.
Conclusion: An 8%+ dividend is built to last only if it passes the FCF coverage, low debt, and sector stability tests. Use these three signals as your gatekeeper before committing capital. For deeper analysis on how dividend stocks perform during geopolitical events, check out our analysis on Micron’s rally and market rebound. Also, explore how SpaceX is becoming a key AI infrastructure play — a reminder that dividends aren't the only path to income.