Strait of Hormuz Reopening Sends Shockwaves Through Markets 📉➡️📈
A single geopolitical announcement from Iran has cleaved the global market into clear winners and losers. The declaration to keep the vital Strait of Hormuz open for commercial traffic during the Lebanon ceasefire acted like a pressure release valve for oil prices, with WTI crude plunging over 14%. This dramatic shift instantly repriced assets across the board, igniting a powerful 'peace trade' rally in sectors long burdened by high fuel costs, while hammering energy producers. This analysis dives deep into the mechanics of the move and what it signals for the weeks ahead.

The Catalyst: From Chokepoint to Open Lane
The Strait of Hormuz is arguably the world's most critical oil transit corridor, handling about one-fifth of global oil consumption. Iran's Foreign Minister Abbas Araghchi's social media post effectively removed a significant geopolitical risk premium that had been baked into oil prices for weeks. Traders who had positioned for continued tension and potential supply disruptions were forced into a rapid unwind.
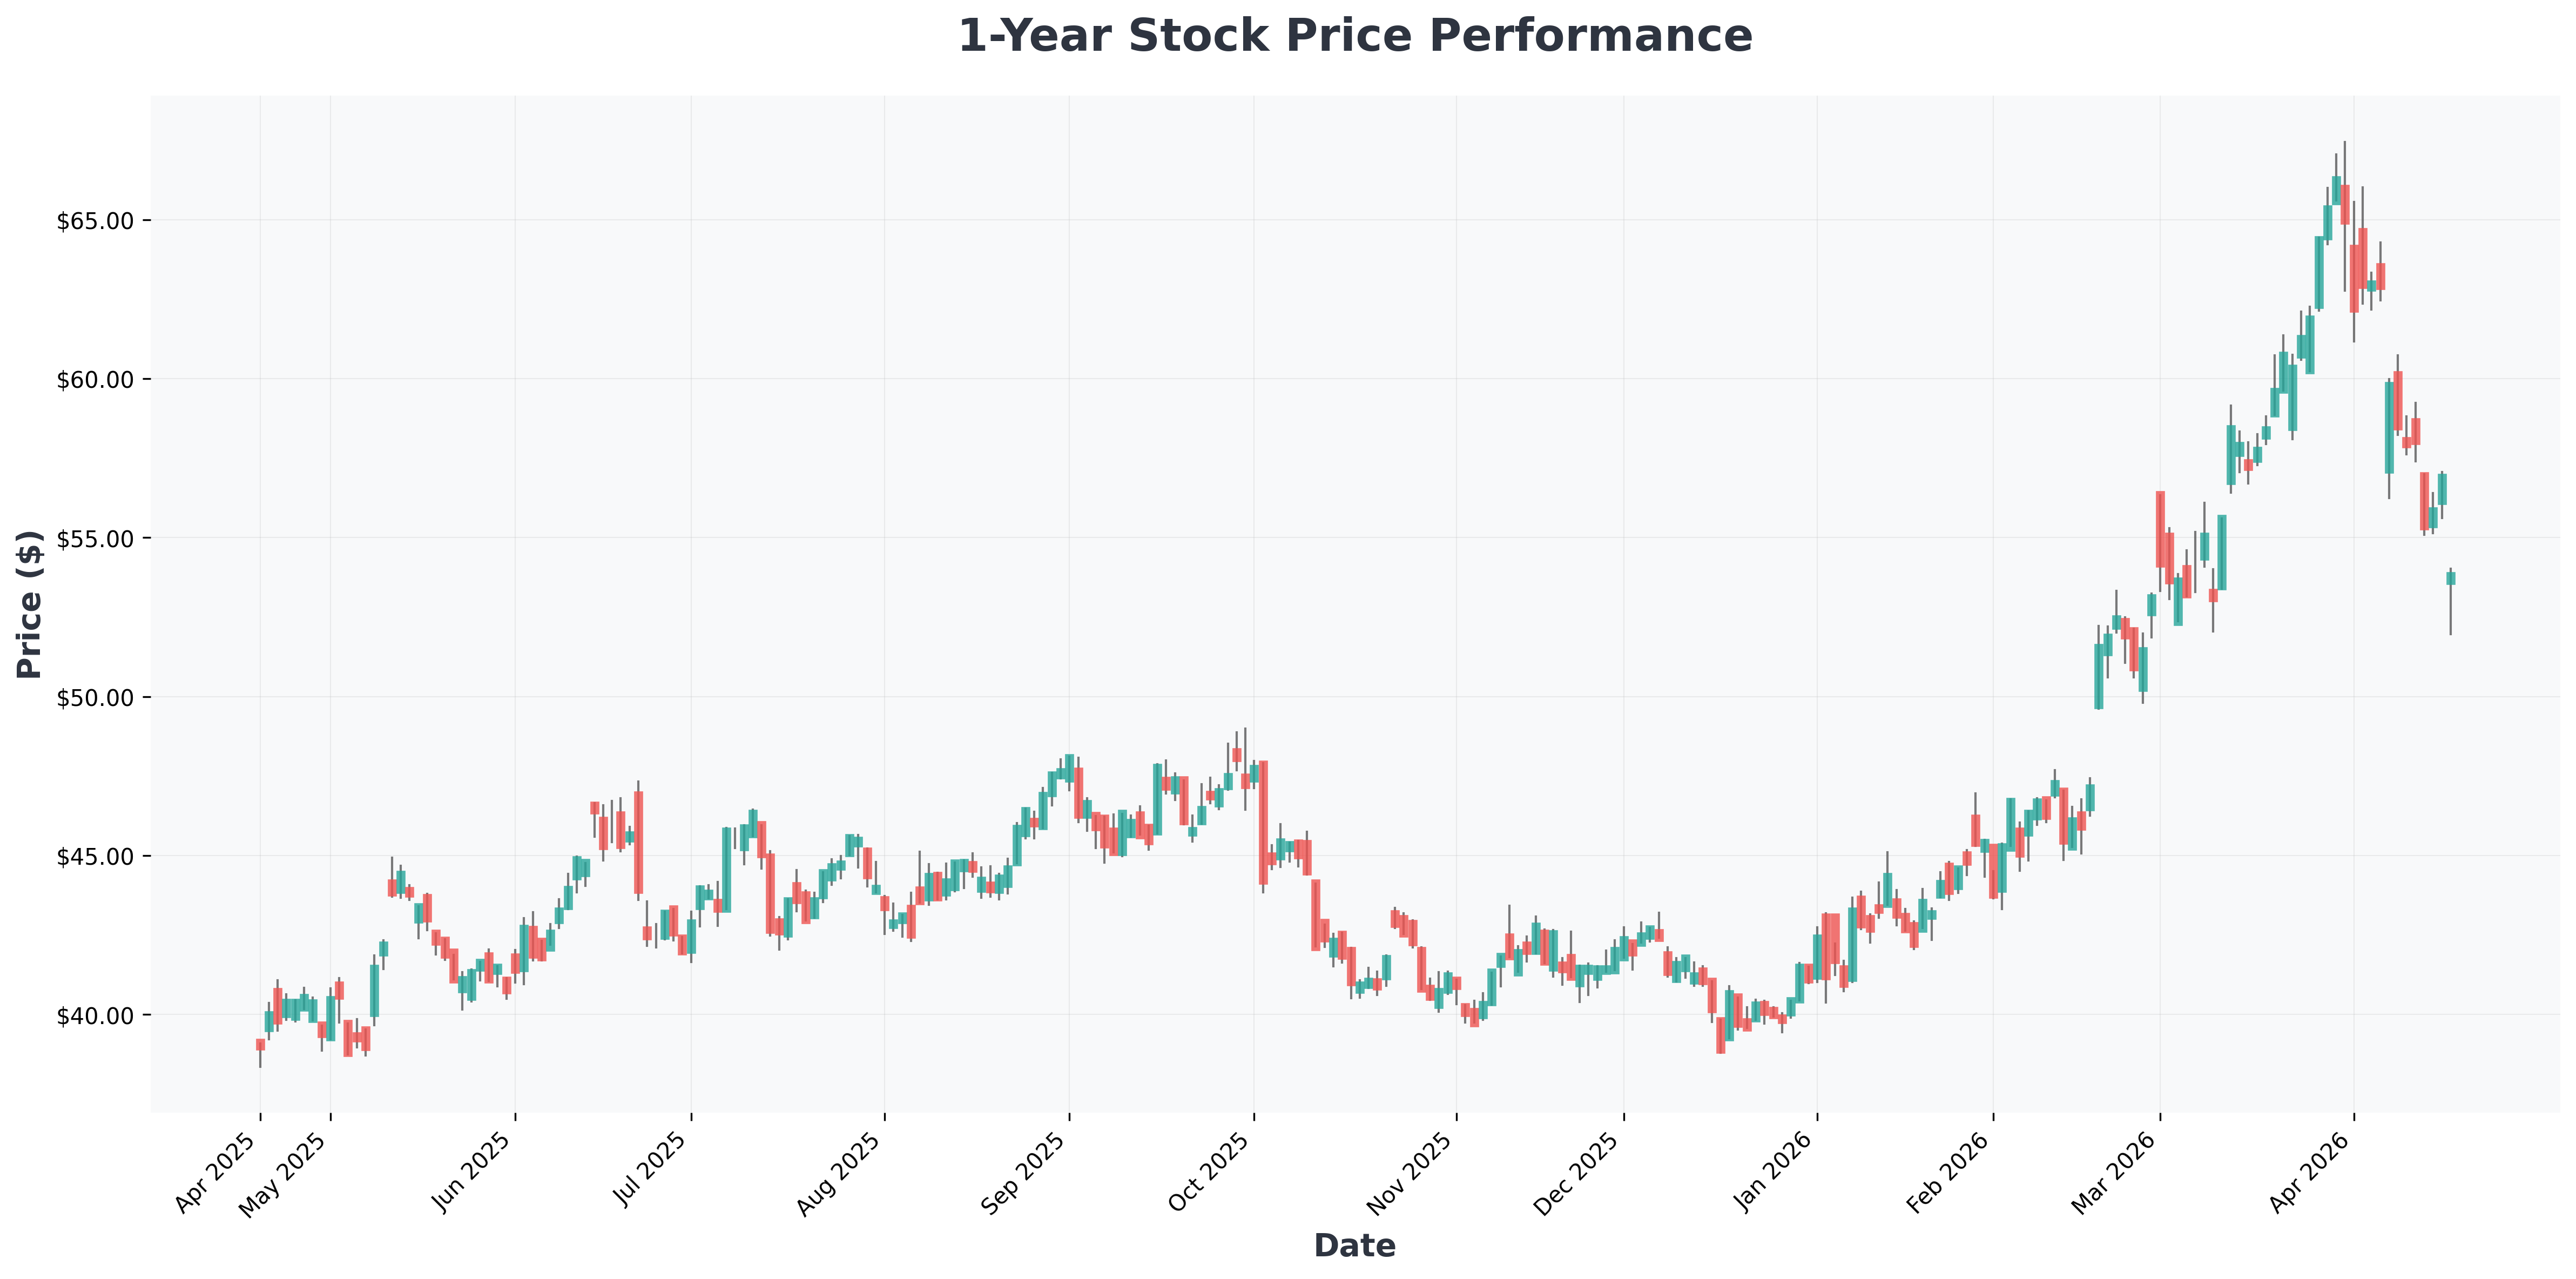
This event is a classic example of a 'geopolitical de-risking' shock. The market's violent reaction underscores how sensitive asset prices are to changes in the perceived probability of supply chain disruptions. The sell-off in crude accelerated an existing downtrend, suggesting the market was already looking for a catalyst to correct from overbought levels driven by fear rather than fundamentals.
This sudden shift has divided market commentators. Is this the start of a sustained 'peace trade' or just a temporary head-fake?
Market Fallout: A Tale of Two Sectors
The immediate reaction created a perfect dichotomy: pain for energy, euphoria for travel.
The Losers: Energy & Related Industries 🛢️
The sell-off was broad and deep across the energy complex:
- Exploration & Production (E&P): APA Corp (-8.55%), Matador Resources (-7.64%), Chord Energy (-6.64%).
- Major Integrateds & Refiners: ExxonMobil (-4.97%), ConocoPhillips (-4.65%), Valero Energy (-5.63%).
- Oil Services: Halliburton (-5.19%).
- Chemicals/Fertilizers: Dow Inc. (-9.06%), CF Industries (-7.93%), LyondellBasell (-7.04%).
These companies face direct hits to revenue forecasts and profit margins. The technical picture for many energy stocks now shows a break below key moving averages, which could invite further selling if the $81/bbl level for WTI fails to hold as support.
The Winners: Airlines & Cruises ✈️🚢
Travel companies, whose largest variable cost is fuel, saw massive relief rallies:
| Company (Ticker) | Gain | Industry |
|---|---|---|
| United Airlines (UAL) | +8.58% | Airline |
| Alaska Air (ALK) | +6.88% | Airline |
| Carnival Corp (CCL) | +6.60% | Cruise |
| Southwest (LUV) | +6.59% | Airline |
| American Airlines (AAL) | +5.59% | Airline |
| Delta Air Lines (DAL) | +5.95% | Airline |
This surge is more than just a short-term pop. It potentially marks a fundamental re-rating if lower fuel costs are sustained, directly improving earnings outlooks. For a broader view of how large-cap moves can define market trends, see our analysis on large-cap performance and portfolio implications.
📊 In-Depth Fundamental Analysis
| Company | Share Price | P/E Ratio | P/B Ratio | ROE | Operating Margin (OPM) | Revenue Growth |
|---|---|---|---|---|---|---|
| AAL (American) | $13 | 75.18 | -2.26 | 0.00% | 3.62% | 2.50% |
| ALK (Alaska) | $45 | 54.70 | 1.27 | 2.36% | 3.19% | 2.80% |
| APA (APA) | $36 | 9.51 | 2.07 | 25.32% | 30.58% | -28.00% |
| CCL (Carnival) | $29 | 12.87 | 3.11 | 27.85% | 9.83% | 6.10% |
| CF (CF) | $113 | 12.56 | 3.58 | 23.40% | 35.31% | 22.80% |
| CHRD (Chord) | $124 | 181.74 | 0.87 | 0.53% | 12.95% | -19.40% |
| COP (ConocoPhillips) | $116 | 18.27 | 2.20 | 12.36% | 16.30% | -6.80% |
| DAL (Delta) | $72 | 10.47 | 2.30 | 24.99% | 3.18% | 12.90% |
| DIA (State) | $0 | 24.22 | 1.38 | 0.00% | 0.00% | 0.00% |
| DOW (Dow) | $36 | 0.00 | 1.60 | -13.82% | -3.14% | -9.10% |
| DVN (Devon) | $44 | 10.61 | 1.77 | 17.74% | 22.66% | -12.10% |
| EOG (EOG) | $128 | 14.71 | 2.31 | 16.83% | 16.94% | 0.00% |
| FANG (Diamondback) | $180 | 32.60 | 1.39 | 3.74% | -86.49% | -9.40% |
| FTAI (FTAI) | $259 | 56.21 | 79.56 | 241.16% | 28.51% | 32.70% |
| FTAIM (FTAI) | $27 | 0.00 | 8.26 | 241.16% | 28.51% | 32.70% |
| FTAIN (FTAI) | $25 | 0.00 | 7.77 | 241.16% | 28.51% | 32.70% |
| HAL (Halliburton) | $37 | 24.77 | 2.97 | 12.27% | 14.90% | 0.80% |
| LUV (Southwest) | $43 | 51.45 | 2.76 | 4.81% | 5.09% | 7.40% |
| LYB (LyondellBasell) | $66 | 0.00 | 2.12 | -6.95% | -0.92% | -9.20% |
| MPC (Marathon) | $214 | 17.12 | 3.64 | 24.19% | 6.29% | -1.20% |
| MTDR (Matador) | $56 | 9.13 | 1.22 | 15.03% | 24.06% | -12.50% |
| NCLH (Norwegian) | $21 | 22.82 | 4.32 | 23.29% | 8.31% | 6.40% |
| OXY (Occidental) | $54 | 39.84 | 1.91 | 5.93% | 10.31% | 148.90% |
| QQQ (Invesco) | $0 | 34.28 | 1.81 | 0.00% | 0.00% | 0.00% |
| RCL (Royal) | $285 | 18.28 | 7.69 | 47.73% | 21.98% | 13.30% |
| SPY (State) | $0 | 28.16 | 1.65 | 0.00% | 0.00% | 0.00% |
| UAL (United) | $102 | 9.98 | 2.15 | 23.99% | 9.14% | 4.80% |
| VLO (Valero) | $224 | 29.58 | 2.82 | 8.30% | 5.93% | -2.10% |
| XOM (Exxon) | $146 | 21.86 | 2.36 | 11.08% | 9.53% | -1.30% |

Forward Outlook: Scenarios and Strategic Implications
Investors must now weigh whether this is a lasting regime shift or a temporary dislocation.
📈 Bull Case Scenario (Sustained Peace Trade)
- Oil Stabilizes at Lower Levels: WTI finds a floor between $75-$85, removing a major inflation/ cost headwind.
- Travel Sector Re-rating: Airlines and cruises see sustained multiple expansion as EPS estimates are revised upward. Consumer demand for travel remains robust.
- Broad Market Tailwind: Lower energy costs act as a tax cut for consumers and corporates, supporting overall economic growth and equity valuations outside the energy sector.
- Technical Insight: The Nasdaq 100's 13-session win streak, highlighted in the news, often occurs in strong momentum phases. A stable or falling oil price could help sustain this growth-oriented market leadership.
📉 Bear Case Scenario (Volatility and Reversal)
- Geopolitical Reversal: The ceasefire proves fragile, or new tensions emerge elsewhere, causing oil to snap back violently.
- Demand Destruction Fears: The oil crash is interpreted as a signal of impending global economic slowdown, outweighing the benefits to travel stocks.
- Mean Reversion in Travel: The airline rally is overdone technically, leading to profit-taking. The sector's history of high debt and competitive pressures re-emerges as a focus.
- Energy Sector Value Trap: The sell-off looks overextended, attracting value buyers and creating a sharp rebound that squeezes short-term 'peace trade' positions.
Conclusion & Risk Management
The Hormuz reopening is a powerful reminder that geopolitics can override fundamentals in the short term. While the travel sector's rally has fundamental merit, it may have moved too far, too fast. Conversely, the energy sell-off seems extreme for a single announcement. A prudent strategy might involve taking partial profits in the biggest travel gainers and beginning to scout for oversold quality in the energy sector, focusing on companies with strong balance sheets and shareholder return programs. For investors seeking income during market rotations, understanding dividend declarations from stable vehicles is key, as discussed in our piece on Invesco's closed-end fund dividends.
⚠️ Investment Risk Warning: This analysis is based on a specific geopolitical event. Markets can reverse rapidly on new headlines. Past performance of sectors mentioned is not indicative of future results. Always conduct your own research and consider your risk tolerance before making investment decisions.