The Hidden Risk Beneath the S&P 500's Record Run 🚨
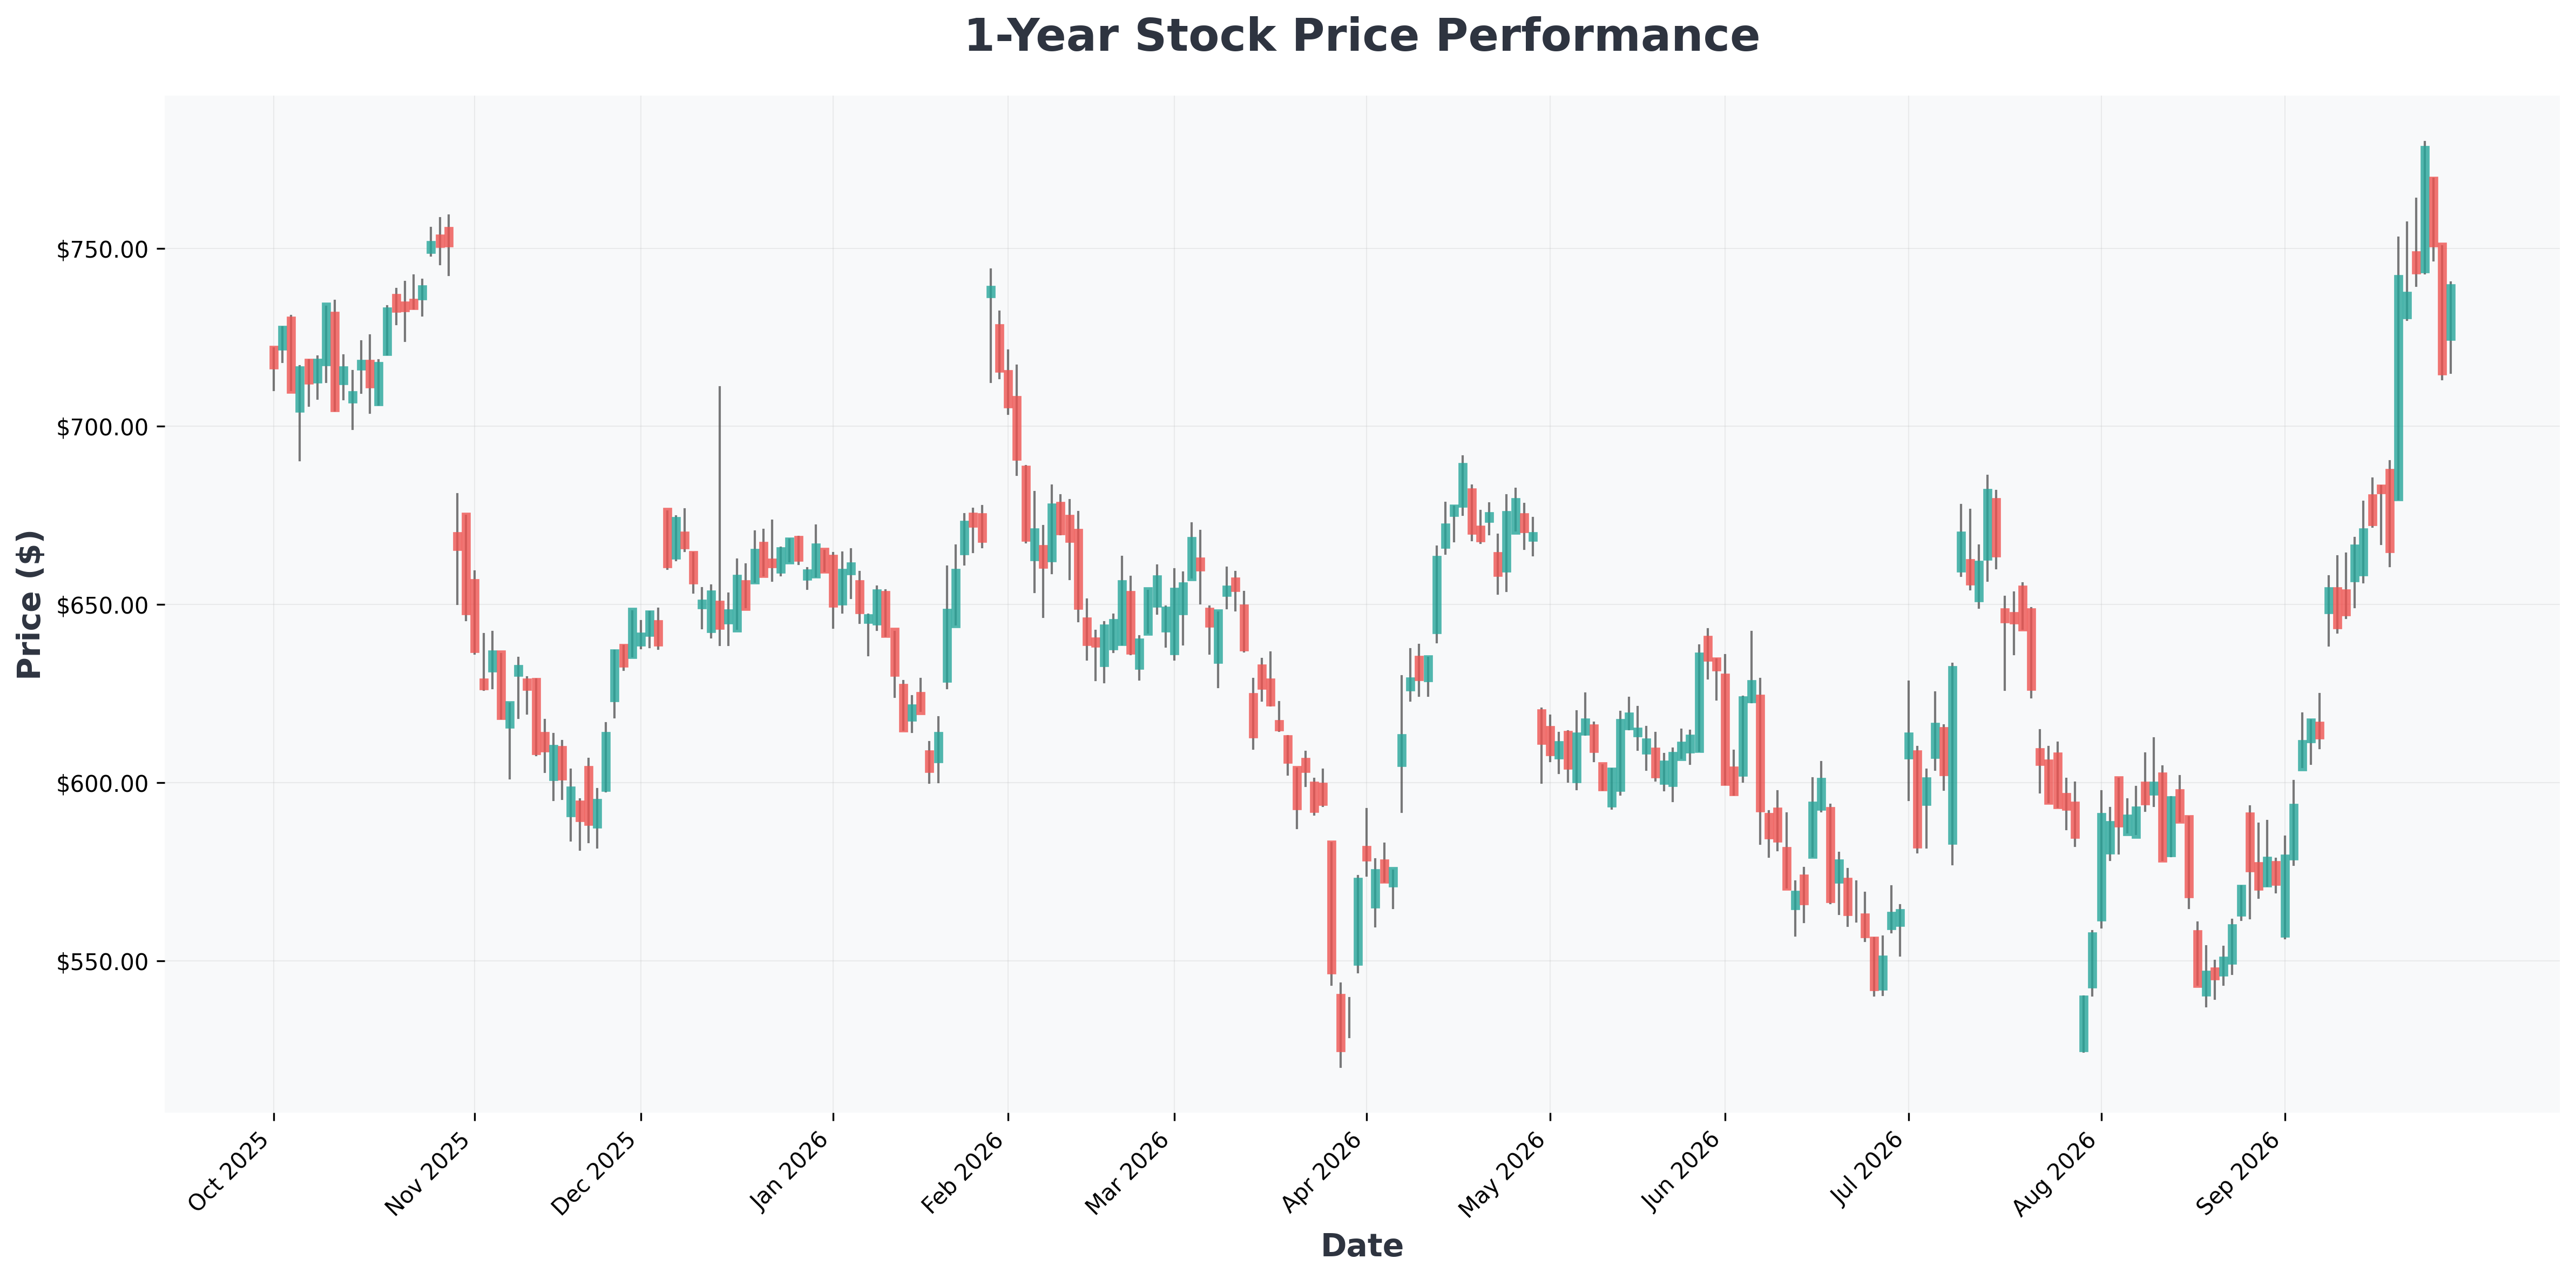
The S&P 500 (^GSPC +0.55%) has delivered total returns of nearly 18% over the past 12 months—well above its historical average of roughly 10%. Artificial intelligence has been the primary engine behind this rally, with the technology sector surging 46% in just six months while all other industries combined returned only about 11%.
But here's the uncomfortable truth: as valuations climb, the largest stocks are consuming a historically unprecedented share of the broader market. When they thrive, they lift everything. When they stumble, they can drag the entire index down with them.
📌 Key takeaway: This isn't a prediction of doom—it's a structural risk that long-term investors need to understand before it becomes a headline.

How Concentrated Is the S&P 500 Really?
As of this writing, the S&P 500 carries a total valuation of approximately $70.4 trillion. The top 10 stocks alone account for $27.4 trillion—roughly 39% of the entire index.
Those top 10 names, in order, are:
- Nvidia
- Apple
- Alphabet
- Microsoft
- Amazon
- Meta Platforms
- Broadcom
- Tesla
- Micron Technology
- Berkshire Hathaway
According to S&P Global data, the last time the index was this concentrated was in 1965—but back then, the top holdings included AT&T, General Motors, IBM, and DuPont. In other words, there was genuine industry diversity at the top.
Today, nearly every top holding is either heavily or tangentially focused on AI development. Amazon, Meta, Microsoft, and Alphabet collectively spent over $300 billion on data centers in the first half of 2026 alone, and those four companies are expected to account for nearly half of global AI infrastructure spending this year.
The Revenue Question Nobody Wants to Ask
Goldman Sachs analysis estimates that hyperscalers will need to generate at least $300 billion in AI revenue over the next few years just to break even—and $1 trillion per year for healthy profit margins. These companies may pull it off. But if they don't, the ripple effect across the entire market could be severe.
For investors evaluating income-generating strategies alongside growth exposure, understanding how to identify sustainable high-dividend stocks can provide a valuable counterbalance to concentrated AI bets.
The market is deeply divided on whether this concentration represents an unprecedented opportunity or a ticking time bomb. Here's how both sides are thinking about it:
History's Warning: The Dot-Com Parallel
The last time market concentration spiked this dramatically was during the dot-com bubble. Between June 1994 and June 2000, the S&P 500's top 10 holdings jumped from 17% of the index's value to over 26%.
Since the current bull market began in late 2022, concentration has spiked again—from roughly 26% to 39%.
Valuation Metrics Are Flashing Red
The S&P 500 Shiller CAPE Ratio currently sits at over 40, inching closer to the record high of 44 set during the dot-com peak. This metric measures long-term market valuations, and a higher ratio suggests stocks are trading at a significant premium.
| Metric | Dot-Com Era (2000) | Current (2026) |
|---|---|---|
| Top 10 Concentration | ~26% | ~39% |
| Shiller CAPE Ratio | 44 (peak) | 40+ |
| Tech Sector Weight | ~30% | ~46% (6-month return) |
| Subsequent 2-Year S&P 500 | -49% | ? |
When the tech sector imploded after the dot-com bubble burst, the S&P 500 lost nearly half its value over the following two years.
The Silver Lining
No two bear markets are identical, and even the strongest indicators can't predict the future. But the S&P 500 is now more saturated with tech stocks than it was during the dot-com bubble.
The good news? Since early 1999—when valuations began soaring—the index has still earned total returns of nearly 1,000%. Long-term investors have historically been rewarded for staying the course.
For those looking at industrial and infrastructure angles that may benefit from the EV and SDV shift regardless of AI sentiment, the Vehicle Control Unit market growth forecast offers a compelling diversification narrative.
📊 In-Depth Fundamental Analysis
| Company | Share Price | P/E Ratio | P/B Ratio | ROE | Operating Margin (OPM) | Revenue Growth |
|---|---|---|---|---|---|---|
| AAPL (Apple) | $336 | 38.44 | 45.60 | 148.75% | 32.62% | 16.40% |
| AMZN (Amazon.com,) | $251 | 20.16 | 4.90 | 30.56% | 13.69% | 19.60% |
| AVGO (Broadcom) | $353 | 45.44 | 16.89 | 44.25% | 54.31% | 85.50% |
| GOOG (Alphabet) | $347 | 17.40 | 6.82 | 48.68% | 34.03% | 24.20% |
| GOOGL (Alphabet) | $350 | 17.56 | 6.88 | 48.68% | 34.03% | 24.20% |
| META (Meta) | $733 | 27.66 | 7.15 | 29.85% | 34.83% | 28.00% |
| MSFT (Microsoft) | $517 | 28.76 | 8.68 | 34.04% | 45.11% | 17.70% |
| MU (Micron) | $1,070 | 24.20 | 11.99 | 66.64% | 80.37% | 345.70% |
| NVDA (NVIDIA) | $230 | 29.11 | 24.28 | 117.21% | 66.24% | 105.90% |
| TSLA (Tesla,) | $351 | 322.07 | 15.96 | 4.67% | 1.41% | 25.50% |

Scenario Analysis: What Could Happen Next
🟢 Best-Case Scenario
| Factor | Outcome |
|---|---|
| AI revenue materializes | Hyperscalers generate $1T+ annually |
| Earnings catch up to valuations | CAPE ratio normalizes without price decline |
| Broadening participation | Mid-cap and value sectors rotate higher |
| S&P 500 12-month outlook | +8% to +12% |
🔴 Worst-Case Scenario
| Factor | Outcome |
|---|---|
| AI spending fails to generate ROI | $300B+ in capex becomes stranded |
| Top 10 stocks correct 20-30% | Index falls 15-25% |
| Concentration unwinds rapidly | Forced selling amplifies decline |
| S&P 500 12-month outlook | -15% to -25% |
Historical Precedent Check
In the dot-com aftermath (2000-2002), the S&P 500 fell approximately 49%. However, the index recovered fully by 2007 and has since delivered nearly 1,000% total returns from the 1999 starting point. The pattern suggests that even severe drawdowns are survivable for patient investors.
The Bottom Line for S&P 500 Investors
Staying invested for the long haul has been a historically proven way to protect and grow your portfolio—regardless of what the next few years bring. But understanding where your risk is concentrated is equally important.
If your portfolio is heavily weighted toward a standard S&P 500 index fund, you're implicitly making a massive bet on 10 AI-focused companies. That's not necessarily wrong—but it should be a conscious choice, not an accident.
💡 Actionable insight: Consider whether your current allocation reflects your actual risk tolerance. Diversification isn't about abandoning growth—it's about ensuring you can stay in the game long enough to capture it.