A Signal Last Seen at the Dot-Com Peak 🚨
In any market cycle, a small group of stocks tends to drive the bulk of index gains. But the current bull market is narrower than almost any in modern history — and a specific technical signal is flashing a warning that hasn't appeared since the late 1990s.
According to recent research, around 70 S&P 500 members have shown negative monthly beta over the trailing 36 months. That means these stocks have been moving opposite to the broader market — an anomaly that historically clusters around major market tops.
The last time the percentage of negative-beta S&P 500 constituents reached this level was during the height of the dot-com bubble. Investors should note: this isn't a timing tool, but it is a breadth warning.
📌 Key takeaway: A bull market carried by a handful of names is fragile by design.

Why Negative Beta Matters More Than You Think 📊
Beta measures how much a stock moves relative to the market. A beta above 1 means wider swings; between 0 and 1 means muted moves; below 0 means the stock moves inversely to the index.
As Janus Henderson's Richard Bernstein recently noted, stocks with negative betas are "exceptionally rare" — yet the market's narrow leadership has pushed a near-record number of companies into that territory.
The Dot-Com Parallel
During the run-up to the 2000 crash, negative-beta stocks spiked — but the real peak came after the bubble popped. As internet names collapsed, capital rotated into defensive, non-correlated names, driving their betas negative.
That's the trap: the negative-beta stocks of today may not stay negative-beta tomorrow. When leadership breaks, correlations tend to snap back toward 1, and the diversification you thought you had disappears.
For investors tracking the AI-driven leadership theme, this dynamic is worth understanding in depth — see our breakdown of how the AI bubble narrative just flipped across software and semiconductors for the sector-level view.
Market participants are sharply divided on what this negative-beta signal actually means for the months ahead.
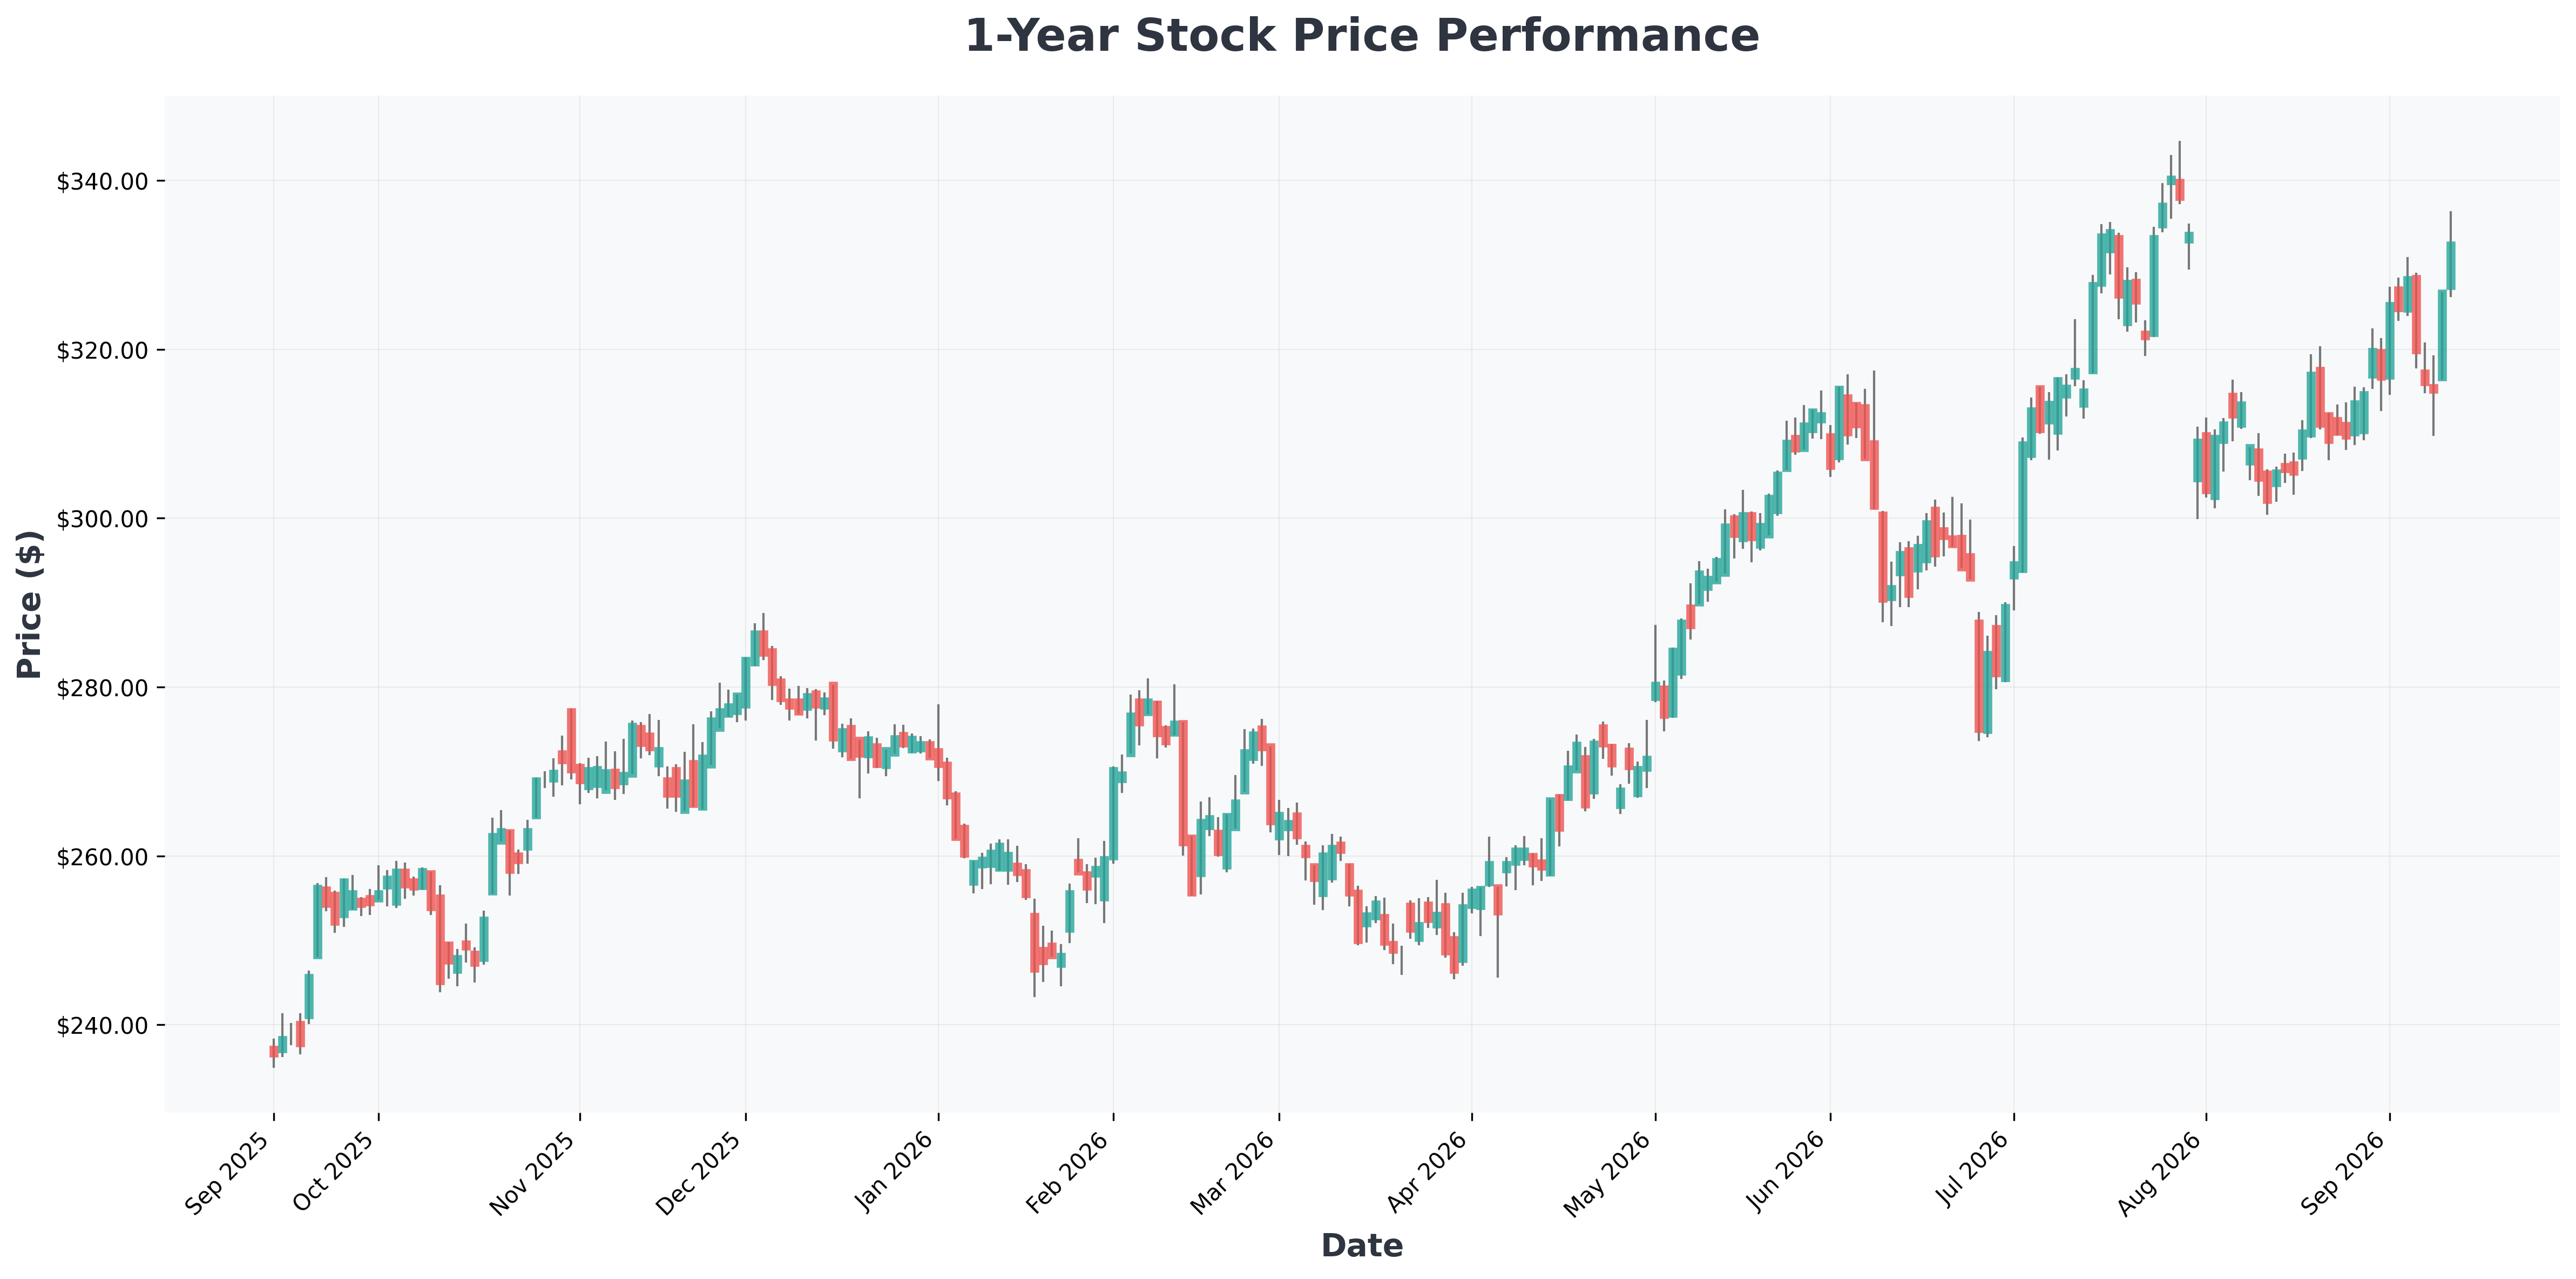

Scenario Analysis: What History Suggests 🔍
| Scenario | Historical Precedent | Likely Market Behavior | Investor Implication |
|---|---|---|---|
| Soft Rotation | 1998–1999 | Leadership broadens gradually; negative-beta names revert | Stay invested, tilt toward quality |
| Sharp Unwind | 2000–2002 | Concentrated leaders crash; correlations spike to 1 | Defensive positioning pays off |
| Extended Melt-Up | 1999 Q4 | Narrow leadership continues 6–12 more months | Under-diversification outperforms — until it doesn't |
Technical Context (AI-Extended Insight)
Historically, when the percentage of negative-beta S&P 500 constituents exceeds ~12%, forward 12-month breadth-adjusted returns have tended to compress. The S&P 500's current 52-week range (roughly 6,316–7,816) shows the index sitting near the upper band — a zone where narrow leadership historically struggles to sustain momentum without a broadening catalyst.
What Actually Protects a Portfolio
Simply buying negative-beta large-caps today is not a reliable hedge. True diversification means looking beyond U.S. large-caps — into other asset classes, or at minimum into quality and value factors.
- Quality stocks: participate in most upside, fall less in drawdowns
- Value ETFs: typically exhibit lower positive beta
- Watch overlap: quality and value often intersect — avoid double-weighting
For a deeper look at which mega-cap leaders are actually worth holding at these levels, see our ranking of the Magnificent Seven and which tech giants are worth buying now.
📊 In-Depth Fundamental Analysis
| Company | Share Price | P/E Ratio | P/B Ratio | ROE | Operating Margin (OPM) | Revenue Growth |
|---|---|---|---|---|---|---|
| MSFT (Microsoft) | $509 | 28.37 | 8.54 | 34.04% | 45.11% | 17.70% |
| META (Meta) | $666 | 25.06 | 6.50 | 29.85% | 34.83% | 28.00% |
| NVDA (NVIDIA) | $212 | 26.89 | 22.40 | 117.21% | 66.24% | 105.90% |
| AAPL (Apple) | $335 | 38.41 | 45.46 | 148.75% | 32.62% | 16.40% |
| TSLA (Tesla,) | $363 | 330.00 | 16.50 | 4.67% | 1.41% | 25.50% |
| GOOGL (Alphabet) | $348 | 17.45 | 6.84 | 48.68% | 34.03% | 24.20% |
| GOOG (Alphabet) | $344 | 17.28 | 6.77 | 48.68% | 34.03% | 24.20% |
| AMZN (Amazon.com,) | $255 | 20.51 | 4.98 | 30.56% | 13.69% | 19.60% |

The Bottom Line 💡
There are no free lunches. If this narrow bull market keeps marching higher on the back of a handful of names, diversifying away from those names will mean lower total returns in the short run.
But that may be a price worth paying. The negative-beta signal doesn't predict when the pattern breaks — only that the market's foundation is thinner than it looks. Investors who understand this trade-off can position deliberately rather than react emotionally.
Actionable framework:
- ✅ Know your true portfolio beta, not just your holdings count
- ✅ Add quality/value exposure for downside cushion
- ✅ Look beyond U.S. large-caps for genuine diversification
- ⚠️ Don't assume today's negative-beta names stay defensive tomorrow
All investing involves risk of loss. This analysis is for educational purposes and not a recommendation to buy or sell any security.