The AI gold rush has been kind to chip designers like Nvidia and AMD, but the real pick-and-shovel play might be hiding in plain sight. 📌 While GPU demand has sent their valuations soaring, a critical bottleneck is emerging: who actually builds these chips?
The answer is Taiwan Semiconductor Manufacturing (TSM), and its position is far stronger than most investors realize. With a 73% share of the global contract chip market and an unassailable technological lead, TSMC is the silent giant that every AI company must pay tribute to. Let's break down why the biggest winner of the AI semiconductor boom isn't the designer, but the manufacturer.

The Hidden Moat: Why Designers Are Expendable, But TSMC Isn't
Nvidia and AMD are locked in a constant battle over GPU architecture, but the hyperscalers—Amazon, Google, Microsoft—are increasingly designing their own custom silicon (ASICs) to cut costs and boost efficiency. Amazon's Trainium chips, for example, are projected to save the company tens of billions in capex annually. Google is already selling its TPUs to third parties.
This is a massive threat to the designers' pricing power. But here's the kicker: every single one of these custom chips—whether designed by Broadcom, Marvell, or an in-house team—still needs to be manufactured by TSMC.
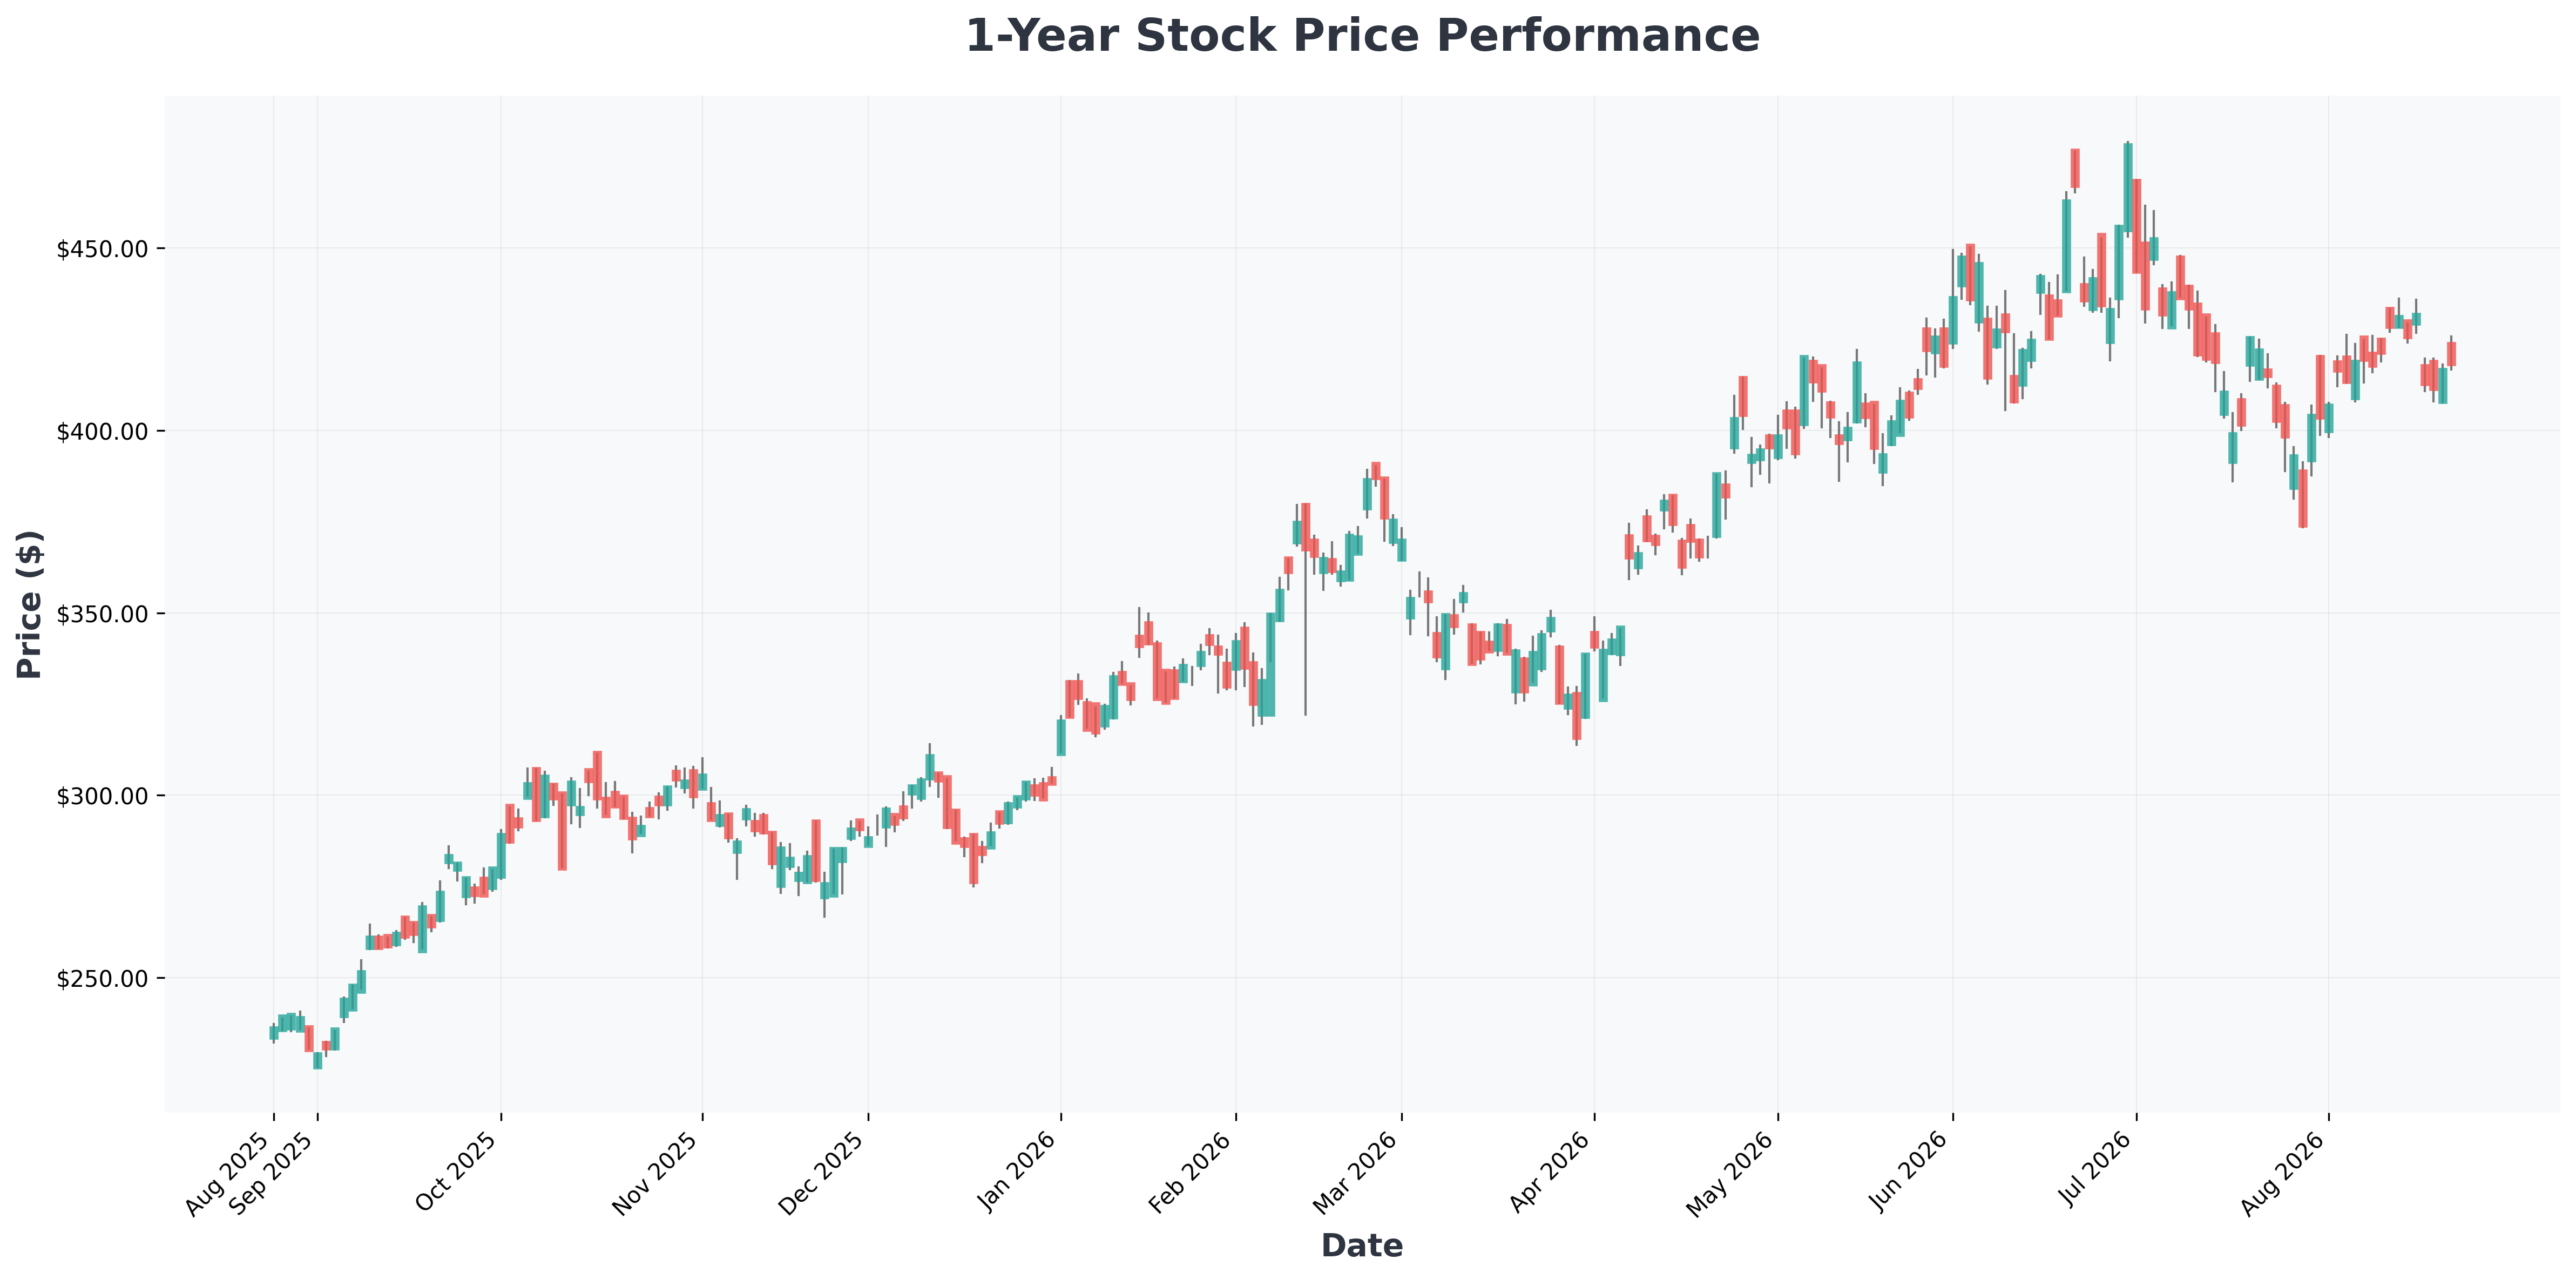
As FOMC decision looms and market dynamics shift, investors are looking for stability. TSMC offers exactly that. Its scale is unmatched; no other foundry has the capacity to print and package AI accelerators at the required quality and speed. Even TSMC itself is struggling to meet demand, which is why it's ramping up capital expenditures to a staggering $60-$64 billion this year, up from $40.9 billion last year. This isn't just a moat; it's a fortress built on a virtuous cycle of scale, R&D spending, and client lock-in.
The Virtuous Cycle & Valuation: The Numbers Tell the Story
TSMC's competitive advantage creates a self-reinforcing loop: win big contracts → build more capacity → spend more on R&D → win new contracts only it can serve. This cycle allows TSMC to maintain its lead and even raise prices, resulting in a stellar 63% gross margin—an extraordinary figure for a manufacturer.
Here’s a snapshot of the key data points:
| Metric | TSMC (TSM) | Industry Context |
|---|---|---|
| Market Cap | $2.2 Trillion | Dominant player in foundry |
| Gross Margin | 63.08% | Exceptional for manufacturing |
| Forward P/E | 24.5x | Discounted vs. growth rate |
| Projected EPS Growth | 30% (2-year) | Faster than the P/E implies |
| Capex (2026) | $60-64 Billion | Unmatched industry investment |
The Bull vs. Bear Debate
While the fundamentals look stellar, the market is always debating the future. Here is a look at both sides of the coin.
This divergence in opinion is exactly what makes the market. Let's weigh the arguments from both the bulls and the bears.
📊 In-Depth Fundamental Analysis
| Company | Share Price | P/E Ratio | P/B Ratio | ROE | Operating Margin (OPM) | Revenue Growth |
|---|---|---|---|---|---|---|
| MRVL (Marvell) | $228 | 78.14 | 10.97 | 16.03% | 14.48% | 27.60% |
| GOOG (Alphabet) | $346 | 17.37 | 6.80 | 48.68% | 34.03% | 24.20% |
| NVDA (NVIDIA) | $209 | 32.06 | 25.94 | 114.29% | 65.60% | 85.20% |
| GOOGL (Alphabet) | $350 | 17.54 | 6.87 | 48.68% | 34.03% | 24.20% |
| TSM (Taiwan) | $408 | 30.45 | 84.05 | 39.97% | 60.34% | 36.00% |
| AVGO (Broadcom) | $361 | 60.01 | 19.57 | 37.28% | 48.99% | 47.90% |
| AMZN (Amazon.com,) | $262 | 21.06 | 5.12 | 30.56% | 13.69% | 19.60% |
| AMD (Advanced) | $459 | 116.76 | 11.14 | 10.20% | 17.25% | 50.10% |

Scenario Analysis & The Bottom Line
Best-Case Scenario: AI demand continues to outpace supply. TSMC successfully raises prices, maintains its 90%+ share in advanced nodes, and its 30% EPS growth materializes. The stock re-rates higher as investors realize its criticality, potentially pushing the share price significantly above current levels. 🚀
Worst-Case Scenario: A severe global economic downturn causes hyperscalers to slash AI capex budgets. Geopolitical tensions over Taiwan escalate, causing a risk premium to be applied to the stock. While TSMC's dominance would remain, its growth would slow, and the multiple could contract, leading to a period of share price stagnation or decline. ⚠️
Conclusion: TSMC is the pick-and-shovel play of the AI era. While Nvidia and AMD face the risk of customers becoming competitors, TSMC is the indispensable partner to all of them. At 24.5x forward earnings with 30% projected growth, the valuation is surprisingly reasonable for a company with this level of dominance. For investors looking for a core holding to play the AI boom without the designer risk, TSMC is arguably the safest and most powerful bet in the semiconductor space. 💡
Disclaimer: This analysis is for informational purposes only and does not constitute financial advice. Always do your own research before making investment decisions.
Related Reads: