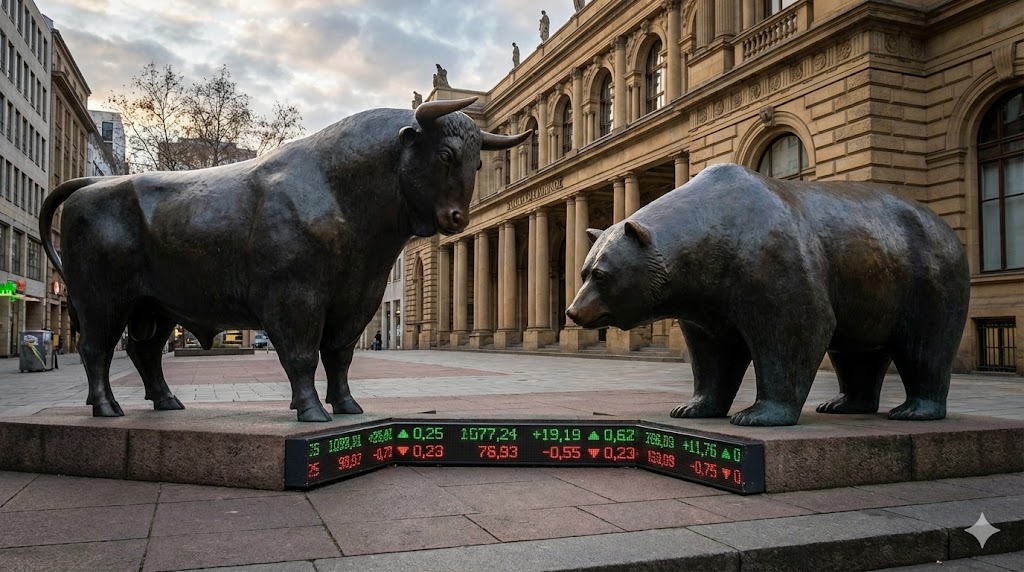
📈 The 2026 S&P 500 Outlook: A Wall Street Consensus?
The S&P 500 continues its record-breaking run in 2025, fueled largely by the AI boom. While concerns about overvaluation persist, leading investment banks are projecting significant further gains for the index in 2026. From current levels around 6,850, here's where the experts think the market is headed.
🏦 Breaking Down the Major Bank Targets for 2026
Wall Street's top firms have laid out a range of optimistic year-end targets, predicated on sustained earnings growth.
-
Deutsche Bank: 8,000 🚀
- The most bullish call, implying ~16% upside from current levels.
- Expects double-digit earnings growth to continue driving the market.
-
Morgan Stanley & Wells Fargo: 7,800 📊
- Projects ~14% growth, citing more room for corporate earnings expansion.
-
HSBC & J.P. Morgan: 7,500 ⚖️
- A more conservative ~9% return forecast.
- JPMorgan notes a path to 8,000 is possible if the rate-cutting cycle accelerates.
Despite the optimistic targets, the market remains divided. Here's the core of the debate between Bulls and Bears.

🤔 The Market Debate: Bullish Conviction vs. Bearish Caution
📊 In-Depth Fundamental Analysis
| Company | Share Price | P/E Ratio | P/B Ratio | ROE | Operating Margin (OPM) | Revenue Growth |
|---|---|---|---|---|---|---|
| Alerian | $0 | 0.00 | 0.00 | 0.00% | 0.00% | 0.00% |
| Deutsche | $38 | 12.93 | 0.80 | 7.60% | 32.09% | 8.90% |
| DB | $0 | 0.00 | 0.00 | 0.00% | 0.00% | 0.00% |
| DB | $0 | 0.00 | 0.00 | 0.00% | 0.00% | 0.00% |
| DB | $0 | 0.00 | 0.00 | 0.00% | 0.00% | 0.00% |
| HSBC | $83 | 17.52 | 8.38 | 9.29% | 39.95% | 4.80% |
| JP | $305 | 15.22 | 2.40 | 16.13% | 42.65% | 2.50% |
| Morgan | $186 | 18.17 | 2.95 | 15.73% | 39.43% | 11.00% |
| Inverse | $0 | 0.00 | 0.00 | 0.00% | 0.00% | 0.00% |
| Wells | $87 | 13.91 | 1.64 | 11.73% | 32.22% | 5.00% |

🎯 Investor Takeaway: Strategy Over Speculation
Focusing on a long-term plan is more crucial than fixating on any single year's forecast.
Best & Worst-Case Scenarios
| Scenario | Conditions | S&P 500 Implication | Investor Action |
|---|---|---|---|
| Best Case 🏆 | AI productivity boom, soft landing, rate cuts | Breaks 8,000, >15% annual return | 📈 Stay invested, continue dollar-cost averaging |
| Base Case 📍 | Moderate growth, rates hold steady | 7,500 - 7,800, 8-12% return | ⚖️ Rebalance, maintain diversified exposure |
| Worst Case ⚠️ | Recession, sticky inflation, geopolitical shock | Tests 6,000, correction territory | 🛡️ Increase cash, shift to defensive assets |
Conclusion: The Long Game Wins
As Warren Buffett advises, forecasts reveal more about the forecaster than the future. Instead of timing the market based on predictions, consider a disciplined approach through broad-based index funds like S&P 500 ETFs. This ensures participation in the market's long-term growth while mitigating single-stock risk.
This content is for informational purposes only and not investment advice. All investments involve risk, including the possible loss of principal.